There are a lot of different ways that you can track the market and pull information to find stocks that might make attractive investment opportunities. One method that I find useful is to periodically check the movement of individual sectors versus the broad market. The saying, “a rising tide lifts all ships” for many is interpreted as simply as possible to mean that if the market at large is going up, the chances you’ll be right about making a bullish investment are pretty favorable. I like to think about the question in a bit more granular sense, because the truth is that in the broadest sense, a more accurate version of the saying is, “a rising tide lifts most ships.”
Over the years, I’ve come to appreciate the ebb and flow of market activity between the different sectors of the economy. That’s because understanding that no matter what the broad market is doing, there are always stocks that are moving in a different pattern than the market opens the possibilities for a lot of different kind of investing and trading opportunities. Want to be bullish when the broad indices are clearly bearish? Find a sector that has been outperforming the indices, and then start going through stocks in that sector that match that pattern.
Particularly as it relates to my approach to value investing, I’ve learned that there is often value in an extended, bullish market environment to pay attention to sectors that are lagging, or possibly even moving directly opposite to the direction of the major indices. That’s one of the reasons that this week the Transportation sector started to draw my interest. Year to date, the sector is up, as is the broad market; but while the S&P 500, the Dow and the NASDAQ are all driving to new all-time highs, Transportation stocks have been tracing a mostly sideways trend since late February of this year, and are actually down about -7.3% since late April, as measured by the S&P Transportation SPDR ETF (XTN). That pattern is just distinct enough from the broad market’s movement to be interesting for a value investor with a contrarian bent.
Within the Transportation sector, one of the industries that most analysts seem to favor the most right now are rail stocks, while Trucking companies seem to be a bit out of favor. Again, that creates another divergence from the market that I think is interesting, because it has put a lot of pressure on stocks like Knight-Swift Transportation Holdings Inc. (KNX). It’s price pattern matches XTN’s pattern almost exactly since late April, but is also at the lower end of a long-term downward trend that actually dates back to the beginning of 2018 when the stock peaked at around $52 per share. Is the stock’s current sideways pattern an indication that it could be building a consolidation base that could see the stock retest those highs? Maybe; the company has a solid fundamental profile, with an intriguing value proposition that to me makes the stock worth paying attention to. Take a look.
Fundamental and Value Profile
Knight-Swift Transportation Holdings Inc., formerly Swift Transportation Company, and created via merger with Knight Transportation, provides truckload services in North America. The Company also provides rail intermodal and non-asset based freight brokerage and logistics management services. The Company provides its services across United States, Mexico and Canada using its dry van, refrigerated, flatbed and specialized trailers, and intermodal containers. As of September 10, 2017, the Company had a fleet of approximately 23,000 tractors and 77,000 trailers. It operates through its Knight Transportation, Swift Transportation, and Barr-Nunn branded subsidiaries. KNX has a current market cap of about $5.5 billion.
Earnings and Sales Growth: Over the last twelve months, earnings have increased by 25%, while revenues declined a little over -5%. In the last quarter, earnings reversed, declining roughly -41%, with revenue dropping about -13.6%. The company’s margin profile shows that Net Income as a percentage of Revenues over the last twelve months was generally healthy at 8.27%, but dipped somewhat in the last quarter to about 7.3%.
Free Cash Flow: KNX’s free cash flow is generally healthy at $350 million over the last year. That translates to a modest, but still useful Free Cash Flow Yield of 6.43%.
Debt/Equity: The company’s Debt/Equity ratio is .12, which is a low number and reflects KNX’s generally conservative use of leverage. Their balance sheet shows $576.28 million in long-term debt, versus just about $122.5 million in cash and liquid assets. While the company’s balance sheet and operating margins generally indicate there should be no problem servicing the debt they have, liquidity is a bit tight and could be a concern if Net Income continues to decline.
Dividend: KNX’s annual divided is $.24 per share and translates to a yield of about .76% at the stock’s current price. As dividend yields go, that isn’t very impressive, so the main takeaway is the simple fact that the stock does actually pay a dividend, in an industry where most stocks do not.
Price/Book Ratio: there are a lot of ways to measure how much a stock should be worth; but one of the simplest methods that I like uses the stock’s Book Value, which for KNX is $32.04 and translates to a Price/Book ratio of .98 at the stock’s current price. The stock’s historical average Price/Book ratio is 2.62, which provides a target price for the stock at nearly $84 per share. That’s more than 150%% above the stock’s current price, and is probably a little over-optimistic given the stock’s all-time high price is only at around $52; but the stock’s current Price/Cash Flow ratio is also more than 50% below its historical average, which means that using the stock’s 2018 high as a long-term target is pretty reasonable.
Technical Profile
Here’s a look at the stock’s latest technical chart.
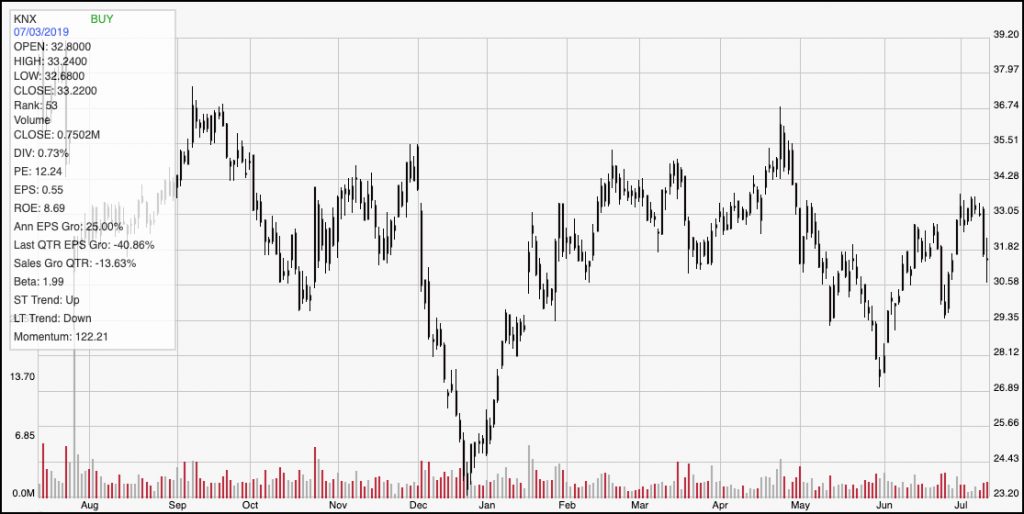
Current Price Action/Trends and Pivots: The chart above shows the last twelve months of price activity for KNX. Given the stock’s sideways pattern since April, this seems to be a more useful view for purposes of near-term technical analysis. At the beginning of July, the stock hit resistance at around $33, and has retraced from that point in just the last couple of days. Current support is somewhere between the stock’s current level, which is around $31.50 and $30.50 per share. A break below that support point could see the stock test new support around $28, and a drop below that point could signal a new short-term bearish trend. If the stock manages to push above current resistance at $33, it should have short-term momentum to test the top end of its sideways trading range at around $36. A break above that level would likely indicate a new bullish trend is forming, with upside to somewhere between $40 to $42 expected from that bullish signal.
Near-term Keys: If you like KNX’s fundamentals, I think the value proposition is already good enough to warrant thinking about taking a long-term position in this stock. If you prefer to work with shorter-term strategies, pay attention to the stock’s current support and resistance levels. Use a break above $33 as a signal to buy the stock or work with call options with a short-term target at around $36, while a break below $30.50 could be a useful signal to think about shorting the stock or working with put options, with $28 as a near-term target price.