One of the challenges that most people have to grapple with if they’re new to investing is the volume of data that generally needs to absorbed to determine if a stock is a useful investing opportunity. Depending on who you talk to and the investing method they prefer, you’ll find that there are as many opinions about what information is important as there are different investing strategies.
Over the course of more than two decades associated with the stock market, I’ve come to rely on a combination of technical and fundamental analysis principles to help inform my investing decisions. One of the most basic sets of data that I’ve learned to rely on is a simple check of a stock’s recent price activity and performance against the industry or sector that it resides in, as well as the broad market. The principle is simple enough, but has multiple reasons that I think it’s useful.
For one thing, looking at a stock in a sector that may have underperforming the rest of the market, but that may have started picking up steam can mean that while the sector may have recently been out of favor with the broad market and large, institutional investors, it could be picking up interest now. Determining whether the stock’s current pattern matches or differs with the sector’s pattern can provide clues about the suitability of the stock itself for a strategy I might be thinking about.
It isn’t always necessary to work only with stocks that match their industry or sector’s recent price activity; sometimes the difference is just as useful for a certain investing opportunity as a close correlation might be for another. Looking at the Industrials sector is a good example of what I mean. As measured by the S&P 500 Industrial Sector SPDR ETF (XLI), the sector is up a little over 19% year to date, which sounds really nice at first blush. Over the last few months, however, the sector has mostly held in a narrow range between support and resistance, which means that most of those gains came in just a few months, from January to March of this year. From a technical standpoint, that could mean that the sector is losing bullish momentum and sentiment among institutional investors, who are the biggest drivers of sector trends, could to start to turn bearish. That could be a warning sign that Industrial stocks might offer limited opportunities for bullishly-oriented trades.
Paccar Inc. (PCAR) is a large-cap Industrial stock that has a number of fundamental strengths working in its favor right now. The name of the company might not be immediately familiar to you, but I’m willing to bet you’re used to seeing their Peterbilt and Kenworth heavy-duty highway trucks. The stock’s price performance correlates pretty closely with the Industrials sector, which means that if you happened to start working with the stock at the beginning of the year and still held the stock today, you’d be feeling very good about your results so far. The real question, however is whether or not the stock offers a useful opportunity right now. Let’s take a look.
Fundamental and Value Profile
PACCAR Inc (PACCAR) is an Industrial Machinery company. The Company’s segments include Truck, Parts and Financial Services. The Truck segment includes the design, manufacture and distribution of light-, medium- and heavy-duty commercial trucks. The Company’s trucks are marketed under the Kenworth, Peterbilt and DAF nameplates. It also manufactures engines, primarily for use in the Company’s trucks, at its facilities in Columbus, Mississippi; Eindhoven, the Netherlands, and Ponta Grossa, Brazil. The Parts segment includes the distribution of aftermarket parts for trucks and related commercial vehicles. The Financial Services segment includes finance and leasing products and services provided to customers and dealers. Its Other business includes the manufacturing and marketing of industrial winches. The Company operates in Australia and Brazil and sells trucks and parts to customers in Asia, Africa, Middle East and South America. PCAR has a current market cap of about $25.1 billion.
Earnings and Sales Growth: Over the last twelve months, earnings have increased almost 25%, while revenues improved nearly 15%. In the last quarter, earnings growth was just under 10%, while revenue growth was 3.3%. The company’s margin profile is both solid and consistent: over the last twelve months, Net Income was 9.5% of Revenues, and improved somewhat to 9.69% in the last quarter.
Free Cash Flow: PCAR’s free cash flow is healthy at $1.5 billion over the last year. That translates to a useful Free Cash Flow Yield of 6.09%. A red flag mark is the fact that free cash flow has decline over the last year and half, from about $2.8 billion in the fourth quarter of 2017.
Debt/Equity: The company’s Debt/Equity ratio is .74, reflecting a conservative approach to leverage. PCAR’s balance sheet shows $3.9 billion in cash and liquid assets in the last quarter versus about $6.7 billion in long-term debt. The company’s healthy operating profile, along with solid cash position means that the company has good liquidity and should have no problems servicing the debt they have.
Dividend: PCAR’s annual divided is $1.28 per share and translates to a yield of about 1.76% at the stock’s current price.
Price/Book Ratio: there are a lot of ways to measure how much a stock should be worth; but one of the simplest methods that I like uses the stock’s Book Value, which for PCAR is $26.26 and translates to a Price/Book ratio of 2.76 at the stock’s current price. The stock’s historical average Price/Book ratio is 2.86, suggesting that upside is the stock is pretty limited right now; the stock will be at par with its historical average at $75 per share. PCAR’s Price/Cash Flow is a little more optimistic since it is currently about 15.6% below its historical average, putting the top end of the stock’s upside potential at about $84 per share.
Technical Profile
Here’s a look at the stock’s latest technical chart.
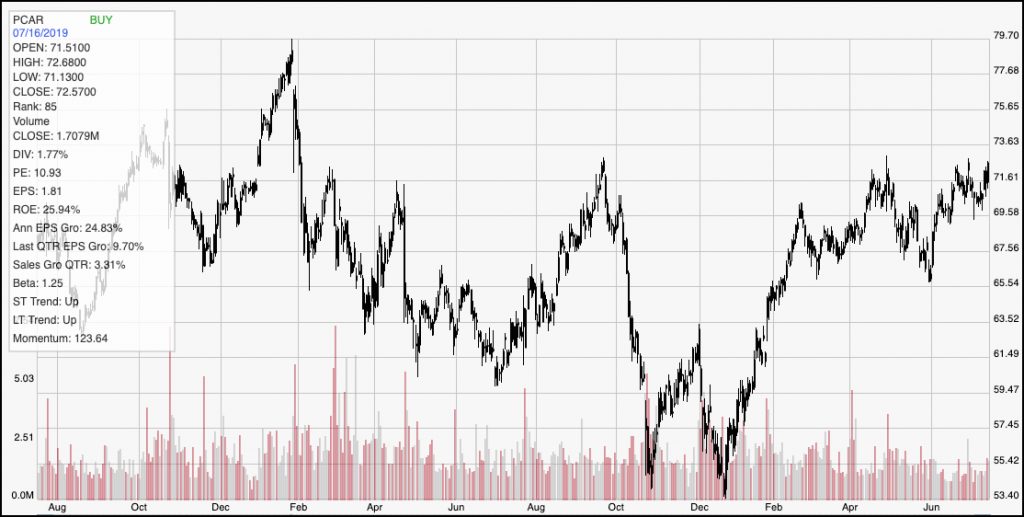
Current Price Action/Trends and Pivots: The chart above shows the last two years of price activity for PCAR. The stock’s current upward trend is easy to see, since the stock has increased from a December low at around $53.50 to its current level around $72.50. Since April, the stock has hovered in a mostly sideways trading range, with resistance right around the stock’s current price, and support around $67.50. Recently, support has tightened up, to around $69.50 per share. A break below $69.50 should yield a pretty quick drop to test the $67.50 support, with $65.50 acting as the next possible support from that point. If the stock can push above current resistance, to about $73, however, the stock’s near-term upside is probably near its two-year high, which is around $79.50.
Near-term Keys: For the most part, I really like PCAR’s fundamentalsIs. Declining free cash flow is a concern, but not a major red flag given the strength of the rest of the company’s metrics, along with their solid balance sheet. At the same time, I don’t think it would be wise to call PCAR a strong value right now. That doesn’t mean the stock doesn’t offer some opportunity, or even that the long-term opportunity has passed by. It does mean that I think long-term upside is more limited than I would be willing to work with for a value-based investment. It also means that the best possibilities lie on the short-term side, via momentum-based trades. A bullish push to $73 would be a strong signal to consider buying the stock or using call options with a short-term exit target at around $79 per share. If you don’t mind being somewhat aggressive, a break below current support to $69 might be a signal to consider working with put options, with a near-term target price at around $65.50.