One of the most underwhelming sectors in this market this year has been Healthcare. As measured by the S&P 500 Healthcare Sector SPDR ETF (XLV), the sector is up just about 6.5% year to date, while the broad market hit a new all-time high earlier and is up a little over 19% since the beginning of the year. There have been a lot of pressures that have weighed on the sector, but perhaps the biggest influence is the prospect of the Trump administration’s efforts to push changes to the healthcare system. While the President’s initial attempt to repeal Obamacare wasn’t successful, that hasn’t stopped him or Republicans from trying other strategies to limit its scope.
In the last 24 hours, the House overwhelmingly voted to permanently block a steep tax on high-cost health insurance plans that previously wasn’t scheduled to go into effect until 2022 but had been considered a central piece of the Affordable Care Act. That was a win for Trump, while about a week ago a judge blocked a plan to force drugmakers to disclose drug prices in their advertising, which later prompted the administration to drop a planned large-scale overhaul of drug rebates – something that should be a positive for pharmacy stocks like CVS Health Corp (CVS) and Walgreen Boots Alliance (WBA) as well insurers like UnitedHealth Group (UNH) and Cigna Corp (CI).
The ebb and flow of politics is something that lends ongoing uncertainty to highly regulated sectors and industries, which means that the extent that any of the news I’ve just described may impact healthcare stock prices remains to be seen. CVS, in particular is another story altogether, since the stock has been in a strong downward trend that dates back to November of last year, when it topped out at around $82. Year to date it is down a little over 14%, but appears to have finally hit a strong consolidation range, with a consistent support level holding at about $52. The stock recently broke above the top-end resistance of that range and could finally be picking up some useful bullish momentum. Among its pressures throughout the year has been concern that the merger it completed in November of last year with insurer Aetna came too large a price. CVS took on a massive amount of debt, which also forced the company to suspend its share buyback program until it lowers its debt load.
In the long run, management and most industry experts expect that the combination of one of the largest and most profitable pharmacy companies with one of the biggest insurers in the country will be able to navigate the transition involved in the integration of two distinctly separate, but complementary businesses; but there appears to be a lot of questions about when that success will translate to the stock price. The stock’s fundamental measurements are a bit mixed, which isn’t that surprising given the merger’s scale and complexity. The stock’s value proposition remains very positive in the long-term, but also shows a couple of puzzling elements. Let’s dive in to the numbers and let you decide whether CVS is a stock you would want to work with under current conditions.
Fundamental and Value Profile
CVS Health Corporation, together with its subsidiaries, is an integrated pharmacy healthcare company. The Company provides pharmacy care for the senior community through Omnicare, Inc. (Omnicare) and Omnicare’s long-term care (LTC) operations, which include distribution of pharmaceuticals, related pharmacy consulting and other ancillary services to chronic care facilities and other care settings. It operates through three segments: Pharmacy Services, Retail/LTC and Corporate. The Pharmacy Services Segment provides a range of pharmacy benefit management (PBM) solutions to its clients. As of December 31, 2016, the Retail/LTC Segment included 9,709 retail locations (of which 7,980 were its stores that operated a pharmacy and 1,674 were its pharmacies located within Target Corporation (Target) stores), its online retail pharmacy Websites, CVS.com, Navarro.com and Onofre.com.br, 38 onsite pharmacy stores, its long-term care pharmacy operations and its retail healthcare clinics. CVS has a market cap of $81 billion. Aetna Inc. is a diversified healthcare benefits company. The Company operates through three segments: Health Care, Group Insurance and Large Case Pensions. It offers a range of traditional, voluntary and consumer-directed health insurance products and related services, including medical, pharmacy, dental, behavioral health, group life and disability plans, medical management capabilities, Medicaid healthcare management services, Medicare Advantage and Medicare Supplement plans, workers’ compensation administrative services and health information technology (HIT) products and services. The Health Care segment consists of medical, pharmacy benefit management services, dental, behavioral health and vision plans offered on both an Insured basis and an employer-funded basis, and emerging businesses products and services. The Group Insurance segment includes group life insurance and group disability products. Its products are offered on an Insured basis. CVS has a market cap of $73 billion.
Earnings and Sales Growth: Over the last twelve months, earnings for CVS increased by about 9.5%, while sales increased nearly 35%. CVS’ margin profile was narrow before the merger, but after the merger is actually negative on both a trailing twelve month basis, at -.08% but turned positive in the last quarter, at 2.3%, respectively. That could be a sign that the transition is gaining traction and that some of the “synergies” management has been promising would be seen and analysts keep trying to find are actually being realized.
Free Cash Flow: CVS’s free cash flow is healthy and improving, at about $6.2 billion over the last twelve months (it was around $4.3 billion in the first quarter of 2019). That translates to a Free Cash Flow Yield of 8.29%, which is also a useful improvement from earlier this year when it was 7.28%.
Debt to Equity: CVS has a debt/equity ratio of 1.45. This is higher than I usually prefer to see, but is primarily attributable to the massive increase in debt the company preemptively took on at the beginning of the year when the merger was first announced. Total long-term debt is $86.8 billion, while cash and liquid assets are about $8.3 billion (up from $6.5 billion in March of this year). By standard measurements, the company’s liquidity comes into question; however CVS has also laid out an aggressive debt reduction program that they expect will lower the total debt the combined company will be working with to much more conservative levels early in 2020. As previously mentioned, they’ve also suspended their dividend increase and share repurchase programs for the time being while they work on debt reduction.
Dividend: CVS pays an annual dividend of $2.00 per share. At the stock’s current price, that translates to an attractive dividend yield of about 3.56%.
Price/Book Ratio: there are a lot of ways to measure how much a stock should be worth; but one of the simplest methods that I like uses the stock’s Book Value, which for CVS is $46.22 — a drop from $57.46 in the quarter previous. This is an element of the stock’s fundamental and value profile that is showing an unusual level of volatility and variability and that I take as evidence that the company is still dealing with post-merger integration issues. Even so, at CVS’s current price, that translates to a Price/Book ratio of 1.21. The stock’s historical average is 2.5, which suggests the stock is still undervalued by at least half and projects a long-term target at around $115. That number lines up with the stock’s all-time highs around $115 and that were last seen in mid-2015.
Technical Profile
Here’s a look at CVS’ latest technical chart.
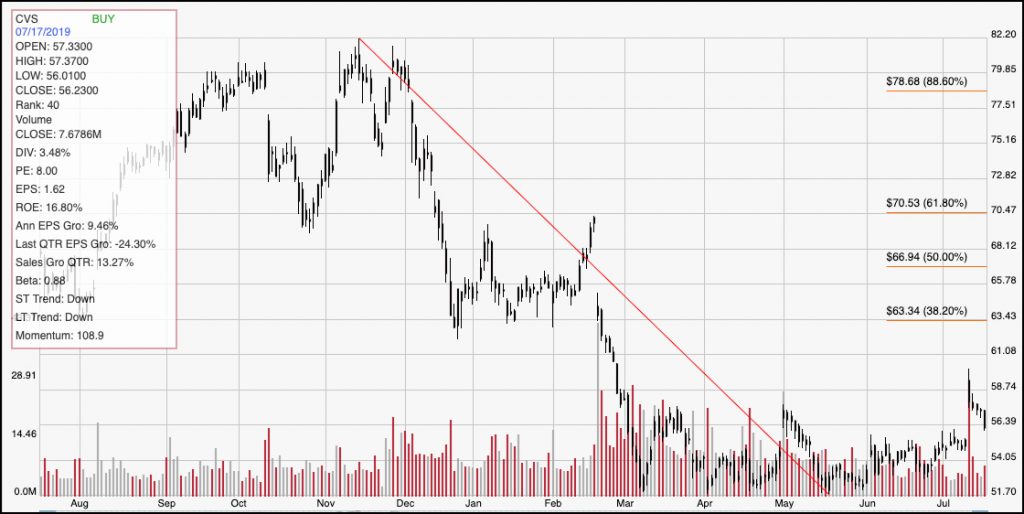
Current Price Action/Trends and Pivots: The chart above clearly shows the stock’s decline from about $82 in November 2018 to its bottom at about $52. The stock has picked up some interesting bullish momentum since late June, rallying to a short-term high a bit below $59 before dropping back to its current level around $56. That could be the beginning of a useful pullback pattern within a short-term upward trend, which could give the stock additional momentum to push even higher. The next major resistance level is around $63.50, which lines up with the 38.2% Fibonacci retracement line shown on the right side of the chart. The stock should be close to new support, probably around $55.50. A drop below that point should see the stock retest its major support level in the $52 range.
Near-term Keys: While the stock’s value proposition is compelling, the truth is that whether that acts as a positive catalyst to boost the stock’s price may not be seen until sometime in 2020. That means that if you like the stock’s long-term prospects, you will likely need to be patient and give the company to start showing more tangible results that its integration efforts are paying off. If you prefer to work with shorter-term strategies, look for a break above $59 as a signal to place bullish, momentum-based trade, either by buying the stock or using call option. $63.50 should be your first exit target price, while a push above that point could see the stock rally to about $66 or possibly $67. If the stock breaks below $55.50, consider shorting the stock or working with put options with a very near-term target price at around $52 to close your bearish trade.