There is a common idiom that states, “a rising tide lifts all ships.” For investors, that saying suggests when the broad market is going up, most stocks should go up as well. On a more macroeconomic level, the same principle applies on a sector basis; if a sector is showing signs of strength, most investors and experts will expect the stocks in that sector to match or at least approximate the broader pattern. This is a principle that I’ve used to good effect for years to help identify the ebb and flow of institutional money from one sector to another, and so to supplement my analysis about where the best market opportunities lie at any given time.
If the idea of following a rising tide makes sense to you, then finding a stock whose movement runs counter to the trend of its broader sector is probably a bit counter-intuitive. A good example of what I mean comes right now from the Materials sector. As measured by the S&P 500 Materials Sector SPDR ETF (XLB), the sector has performed well this year, rising by almost 18% year to date, and picking up even more bullish momentum in the past month, with an increase over that period of about 2.7%. By contrast, one of the most well-known companies in the sector, International Paper (IP) has severely underperformed the sector this year, increasing only about 7.8% year to date, and tracing a long-term downward trend that dates back to February of 2018. Over that period, the stock is down a little over -35%. That downward trend is something that would make most investors want to shy away from IP and go find something else to work with.
As a value-oriented investor, I’ve come to appreciate that stocks in these kinds of patterns, that don’t match the broader trend of the market or even of its sector – can sometimes offer the best bargain opportunities, especially in a mature, extended bull market such as the one we are still in. In fact, the longer the bull market lasts, the more I tend to gravitate to counter-trend stocks, simply because stocks that I see at all-time, extended highs in my view contain greater downside risk than they do upside opportunity. When you add to the picture the fact that IP also carries a generally solid fundamental profile, the fact the stock is trading at a historical low, but showing positive signs of stabilization around those lows only adds to the case to consider IP as a good long-term investment under current market conditions.
Fundamental and Value Profile
International Paper Company is a paper and packaging company with primary markets and manufacturing operations in North America, Europe, Latin America, Russia, Asia, Africa and the Middle East. The Company’s segments include Industrial Packaging, Global Cellulose Fibers, Printing Papers and Consumer Packaging. The Company is a manufacturer of containerboard in the United States. Its products include linerboard, medium, whitetop, recycled linerboard, recycled medium and saturating kraft. The Company’s cellulose fibers product portfolio includes fluff, market and specialty pulps. The Company is a producer of printing and writing papers. The products in Printing Papers segment include uncoated papers. The Company is a producer of solid bleached sulfate board. As of December 31, 2016, the Company operated 29 pulp, paper and packaging mills, 170 converting and packaging plants, 16 recycling plants and three bag facilities in the United States. IP’s current market cap is $17.2 billion.
Earnings and Sales Growth: Over the last twelve months, earnings grew a little more than 18% while revenues were flat, but positive, at 0.39%. In the last last quarter, earnings declined almost -33%, with sales also decreasing -5.18%. This is a red flag, but also something that hasn’t been unusual for a lot of stock in the Materials sector over the same period. A sign of strength that shouldn’t be ignored is the company’s margin profile, which is healthy and has reversed an earlier pattern of deterioration. In the last twelve months, Net Income was 7.31% of Revenues, while in the last quarter, it was 7.51%. The quarterly result is an improvement from about 5.31% earlier in the year, implying that the company’s operating profile has stabilized and could even be improving.
Free Cash Flow: IP’s free cash flow is very healthy and strengthening, at $1.9 billion over the last twelve months. This is a significant increase from the middle of last year, when free cash flow was $ $1.57 billion. This is a good confirmation of the positive pattern I’m reading from my Net Income analysis.
Debt to Equity: IP has a debt/equity ratio of 1.37, implying they are fairly highly leveraged. This is pretty normal for the Containers & Packaging industry, so in and of itself this isn’t a major concern; however, the company’s balance sheet shows that IP’s liquidity could be a concern. In mid-2018, cash and liquid assets were more than $1.1 billion, but that number has declined to $641 in the last quarter. By comparison, the company has a little over $10 billion in long-term debt. Looking into this information in more detail, however shows that this is a deliberate strategy by IP’s management, as they have stated their long-term intent to keep cash and liquid assets at around $600 million to facilitate debt reduction (long-term debt was $10.7 billion in mid-2018) as well as stock buybacks.
Dividend: IP pays an annual dividend of $2.00 per share, which translates to a yield of about 4.59% at the stock’s current price. IP’s high dividend is another good reason to consider the stock as a useful long-term position.
Price/Book Ratio: there are a lot of ways to measure how much a stock should be worth; but one of the simplest methods that I like uses the stock’s Book Value, which for IP is $18.80 and translates to a Price/Book ratio of 2.31 at the stock’s current price. Their historical average Price/Book ratio is 3.86, which provides a strong basis for the stock’s long-term upside. A move to par with the average would put the stock above $72 per share, more than 66% higher than the stock’s current price and even above its all-time high around $67.
Technical Profile
Here’s a look at the stock’s latest technical chart.
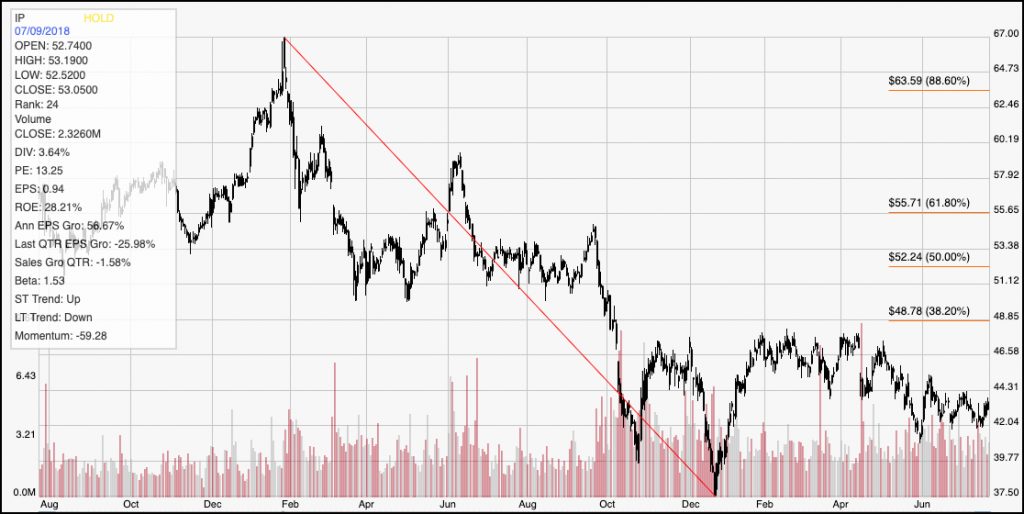
Current Price Action/Trends and Pivots: The diagonal red line traces the stock’s downward trend from January 2018 to the end of the year, and provides the reference for calculating the Fibonacci retracement levels indicated by the horizontal red lines on the right side of the chart. After rebounding from a trend low at around $37.50 at the beginning of the year, the stock peaked around $47, but has traced a new, gradual, intermediate downward trend from that point. Since the beginning of June, that downward trend appears to be stabilizing, with the stock’s range between support and resistance flattening, and also narrowing to a range between $42 for support and a little above $44 for resistance. A break above that resistance, to about $44.50 should provide good momentum for a short-term rally to about $49, where I would expect the next major resistance level to come from the 38.2% Fibonacci retracement line. A drop below $42, on the other hand is a bearish sign that the stock could retest its multiyear low around $37.50.
Near-term Keys: If you don’t mind working with a little volatility over time, and can tolerate a potential swing lower, the value proposition for the stock offers a great long-term opportunity with a very attractive dividend yield to draw from right now. If you prefer to work with shorter trading periods and strategies like swing or momentum trading, look for a push above $44 before taking a long position in the stock or working with call options. A drop below the stock’s current support around $42 could mark an interesting signal to short the stock or work with put options, since the stock isn’t likely in that case to find new, significant support before reaching the $37.50 level marked by its trend low point at the end of 2018.