For growth investors, stocks making new all-time highs are usually seen as the best kinds of stocks to buy. When new all-time highs happen at the top of a long-term upward trend, many of those same investors get even more excited, because traditional trend analysis usually suggests that those are among the highest-probability signals to buy the stock for a new wave of bullish momentum.
This princABTle is one of the reasons that while the Healthcare sector at large has mostly underperformed the rest of the market year to date – as measured by the S&P 500 Healthcare Sector SPDR ETF (XLV), the sector is up about 6.5% since January versus nearly 21% for the S&P 500 Index – Abbott Laboratories (ABT) is among the market’s top performers. The stock is up about 22.5% year to date and nearly 40% over the last twelve months. The stock’s upward trend actually extends over more than two a half years, from a January 2017 low at around $37.50 to its current level just a little below $90. More importantly, in the last week the stock has broken above its latest level of resistance around $85 after its latest earnings release.
A positive reaction by the market to better-than-expected earnings, a strong fundamental profile and impressive price performance are just a few reasons most investors, and even a lot of analysts, seem to singing ABT’s praises. As a value-oriented investor with a contrarian bent, seeing growth-oriented analysts write about the stock’s fundamental strengths as reasons to dismiss notions that the stock might be at greater risk to reverse and move lower might be a little foolish. “Any stock can go down in a bear market,” they might say, “but there is no reason that should happen with this stock right now. #clearskiesahead”
From a technical standpoint, I have to admit that I agree with the stock’s bullish forecast in the near-term. The stock is showing some nice, bullish momentum right now, with sentiment clearly driving the stock to some impressive highs right now. Whether or not that momentum can hold in the long-term, though, is about a little more than just good fundamentals, or about near-term sentiment; it is also about giving investors a reason to see more growth down the road. In the case of ABT, I think the that reward: risk profile for the stock is becoming more and more negatively distorted the longer the run lasts. Most technical indicators show the stock is at the far end of overbought; the stock’s classic valuation metrics also show that it is well north of any level that any reasonable long-term investor would be willing to treat as reasonable. That doesn’t automatically mean ABT is going to start dropping, of course; but it does mean that you might want to proceed cautiously if you want to work with the stock.
Fundamental and Value Profile
Abbott Laboratories is engaged in the discovery, development, manufacture and sale of a range of healthcare products. The Company operates through four segments: Established Pharmaceutical Products, Diagnostic Products, Nutritional Products and Vascular Products. Its Established Pharmaceutical Products include a range of branded generic pharmaceuticals manufactured around the world and marketed and sold outside the United States. Its Diagnostic Products include a range of diagnostic systems and tests. Its Nutritional Products include a range of pediatric and adult nutritional products. Its Company’s Vascular Products include a range of coronary, endovascular, vessel closure and structural heart devices for the treatment of vascular disease. The Company, through St. Jude Medical, Inc., also offers products, such as rhythm management products, electrophysiology products, heart failure related products, vascular products, structural heart products and neuromodulation products. ABT’s current market cap is $17.2 billion.
Earnings and Sales Growth: Over the last twelve months, earnings grew a little more than 12% while revenues improved about 2.75%. In the last last quarter, earnings growth was alittle over 30%, with sales rising nearly 6%. Increasing earnings faster than sales isn’t easy to do, and generally isn’t sustainable in the long-term, but it is also a positive mark of management’s ability to maximize its business operations. The company’s margin profile is also a sign of strength. In the last twelve months, Net Income was 9.35% of Revenues, while in the last quarter, it increased to 12.6%.
Free Cash Flow: ABT’s free cash flow is generally healthy, at $4.4 billion over the last twelve months. This number has declined from about $4.9 billion at the beginning of the year, and it translates to a modest Free Cash Flow Yield of 2.84%.
Debt to Equity: ABT has a debt/equity ratio of .61, which is a low number that implies the company takes a conservative approach to the use of leverage. While the company’s liquidity is generally healthy, it is also showing some signs of deterioration; in the last quarter cash and liquid assets were $3.2 billion versus $18.8 billion in long-term debt. While debt has been mostly stable, in the last years cash has declined from more than $7.55 billion in mid-2018.
Dividend: ABT pays an annual dividend of $1.28 per share, which translates to a yield of about 1.44% at the stock’s current price.
Price/Book Ratio: there are a lot of ways to measure how much a stock should be worth; but one of the simplest methods that I like uses the stock’s Book Value, which for ABT is $17.65 and translates to a Price/Book ratio of 5.01 at the stock’s current price. Their historical average Price/Book ratio is 3.2, which means the stock is overvalued by more than -36% right now, and puts a “fair value” price for the stock at just about $56.48. The stock’s Price/Cash Flow ratio is more favorable, but since it is only about 4.9% below its historical average, it does put the stock’s upside at only about $92.50, which isn’t very far away from its current price.
Technical Profile
Here’s a look at the stock’s latest technical chart.
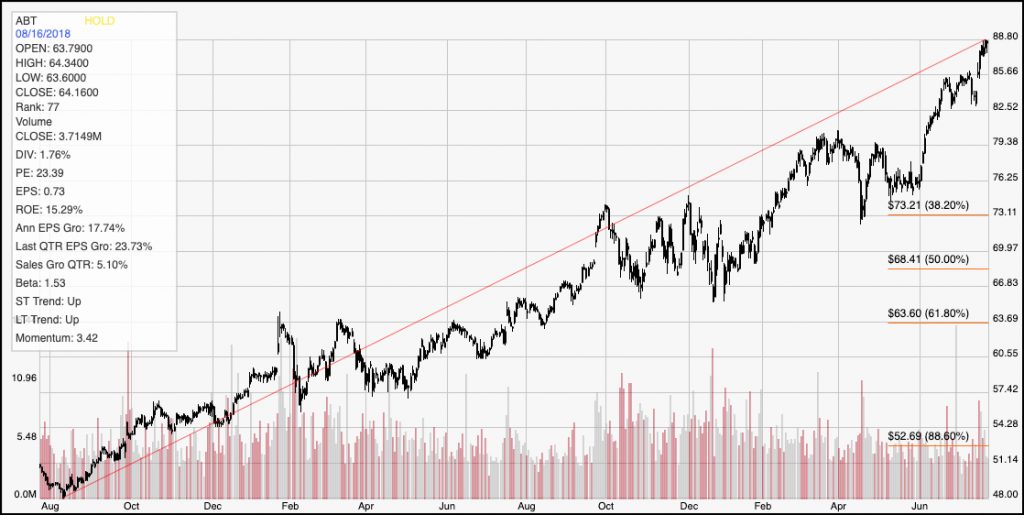
Current Price Action/Trends and Pivots: The diagonal red line traces the stock’s upward trend over the last two years. The stock’s momentum is clearly bullish, and generally it is true that the stock’s recent break above near-term pivot resistance around $85 should provide new support to keep the stock’s momentum on the bullish side; however, given the extremely extended state of the stock’s long-term trend, it also puts a strongly bearish signal on a break below that level. If current support doesn’t hold, the stock could quickly drop to about $73, where the stock’s 38.2% Fibonacci retracement line can be seen. Even if you are a growth-oriented investor, it’s hard to forecast upside of even $15 per share against the $15 of downside risk, much less the $30 that proper, conservative risk management would demand.
Near-term Keys: In the near term, ABT could keep rallying, and so if you prefer to work with swing or momentum strategies, the stock’s current pattern could provide a nice opportunity to buy the stock or work with call options. The last break above resistance, in early June pushed the stock from about $79 to $85, so if you do place a bullish trade, don’t be surprised to see the stock top out around $91 or $92 per share, which is between $3 and $4 away from the stock’s current price. A bearish trade doesn’t have good probabilities of success right now; but if momentum fades and the stock drops below $85, there could be an interesting opportunity to think about shorting the stock or to buy put options with an eye on the stock’s next support level at around $79, or possibly even $73 if bearish sentiment increases. The stock’s fundamentals also don’t support a strongly bearish forecast in the stock right now, so I’m not calling for any kind of bearish trend reversal in the near term; but the stock’s limited long-term upside just doesn’t offer a compelling reason to pay attention to ABT right now.