Throughout most of the last year and a half, the entire Technology sector has seen a marked increase in volatility as trade tensions have led to a high level of uncertainty about the sector. In the last couple of quarters, more and more executives have begun including trade and tariffs among the risks that they are having to confront. Last week didn’t help matters in that regard; even as U.S. and Chinese officials resumed negotiations that will pick up again next month, President Trump announced his intention to impose yet another set of 10% tariffs on remaining untaxed Chinese imports. That is one of the reasons that most of the sector has pulled back in the last week.
Hewlett-Packard Enterprise Co. (HPE) is a company in an interesting industry. Three years ago, HPE was spun off of parent company and tech bellwether HP Inc. (HPQ). Of the two businesses, HPQ is the one you’re probably more familiar with, since that stock is the one that makes the printers and computers, for both consumers and businesses that most people immediately think about when they hear “HP”. Hewlett-Packard Enterprise, on the other hands provides a range of information technology solutions, including servers, storage arrays and software services that the average consumer will never interact with.
HPE occupies a different niche than HPQ – one that has seen its share of price pressure over the last year or so as the price of storage, including memory components has dropped. While a lot of indicators over the last couple of months indicate that most of the oversupply concerns that have driven that decline have abated, trade continues to weigh on the industry. At the end of last week, executives from NetApp and Seagate Technology issued guidance below most analyst estimates, citing lower tech spending by businesses. HPE dropped a little over 6% overnight on Friday in sympathy with that news, and is now sitting just about $1 above its multiyear low near $12 per share. That marks an extension of a long-term downward trend that dates back to February of 2018, when the stock hit its all-time high at around $19.50.
Tariff uncertainty, which is certainly a contributing factor at this point to a slowdown in tech spending, isn’t going away – most economists are now conceding that even as the two largest economies in the world keep talking, actual trade peace doesn’t appear likely at any point this year. That means that businesses with exposure to trade risk – which are now harder and harder to find under the current environment – are more likely to be cautious about expenditures on new or upgraded enterprise-level technology solutions. That puts stocks like HPE at the low end of a trend that could persist through the end of the year. Does that mean you should stay away? HPE has some interesting counters to those concerns, including a number of indications that their fundamentals are improving even as pressures persist. Add to the argument a stable, attractive dividend to provide passive income and a more and more interesting value proposition, and you have a company that is worth a long look.
Fundamental and Value Profile
Hewlett Packard Enterprise Company is a provider of technology solutions. The Company’s segments include: Enterprise Group, Software, Financial Services and Corporate Investments. The Enterprise Group segment provides its customers with the technology infrastructure they need to optimize traditional information technology (IT). The Software segment allows its customers to automate IT operations to simplify, accelerate and secure business processes and drives the analytics that turn raw data into actionable knowledge. The Financial Services segment enables flexible IT consumption models, financial architectures and customized investment solutions for its customers. The Corporate Investments segment includes Hewlett Packard Labs and certain business incubation projects, among others. HPE has a current market cap of $17.8 billion.
Earnings and Sales Growth: Over the past year, earnings increased about 23.5%, while sales declined -4.26%. In the last quarter, earnings were flat, while sales dropped by a little over -5% – numbers that I think are attributable, at least in part to the company’s exposure to international trade. The company operates with a narrow, but improving margin profile; over the last twelve months, Net Income was just .95% of Revenues, but increased to 5.8% in the last quarter.
Free Cash Flow: HPE’s Free Cash Flow is healthy, at nearly $2 billion. On a Free Cash Flow Yield basis, that translates to 11.2%. Just a few months ago, Free Cash Flow was about $1.3 billion, and a year ago was only $117 million. The big improvement in this number, in my opinion is a strong validation of HPE’s improving operating profile based on Net Income.
Debt to Equity: HPE has a debt/equity ratio of .57, which is a conservative number. Their balance sheet shows $3.58 billion in cash against $10.3 billion in long-term debt. Their balance sheet indicates their operating profits are adequate to service their debt, with good liquidity as well, but it should be noted that at the end of 2018, cash was about $5.5 billion.
Dividend: HPE pays a dividend of $.45 per share, which translates to an annual yield of about 3.39% at the stock’s current price.
Price/Book Ratio: there are a lot of ways to measure how much a stock should be worth; but one of the simplest methods that I like uses the stock’s Book Value, which for HPE is $13.62 per share. That is a decline from the end of 2018 at nearly $16 per share, but that also increased in the last quarter from $13.38. At HPE’s current price, that translates to a Price/Book Ratio .97. The stock has actually only been trading publicly for about three years, which means that historical average ratios are less reliable; in this case I like to use the industry average as a reference point. The industry average Price/Book ratio is 3.8 and puts the top end of the stock’s long-term price target at around $51 per share. I think that is an extremely overoptimistic target, given that the stock’s all-time high is only at around $19 per share; however a better measurement comes using the stock’s Price/Cash flow ratio, which is currently trading nearly 96% below the industry average Price/Cash flow ratio. That translates to a more conservative, but still attractive target price at around $26 per share.
Technical Profile
Here’s a look at the stock’s latest technical chart.
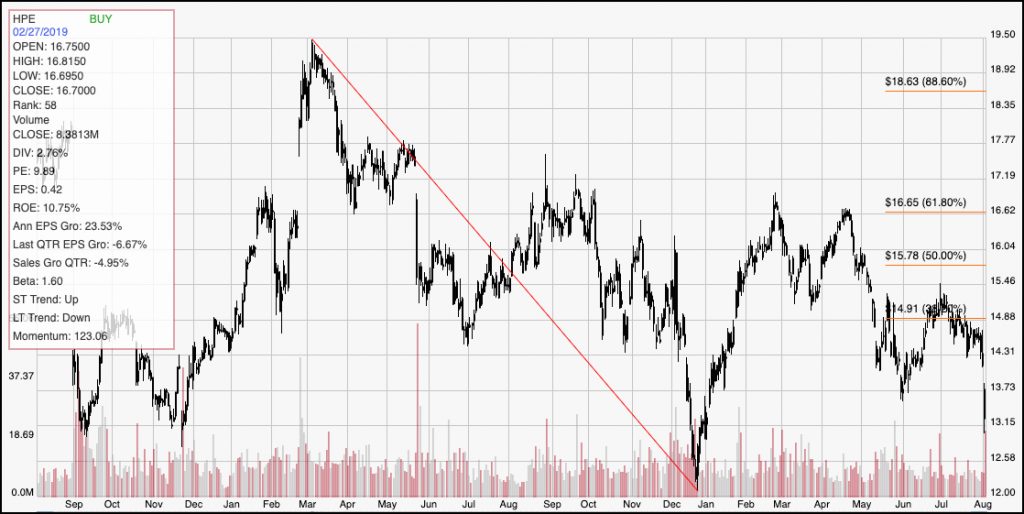
Current Price Action/Trends and Pivots: HPE’s downward slide from February to December of last year is easy to see, and marks the red diagonal line used to calculate the Fibonacci retracement lines shown on the right side of the chart. From that trend low at around $12, the stock rallied strongly, finding resistance more than 30% higher at around $16.65, where the 61.8% Fibonacci retracement line sits. From that peak in April, the stock has dropped back significantly, dropping below the 38.2% retracement line in late May and then using that level as resistance in early July. The latest drop suggests bearish momentum is increasing, with an increasing likelihood the stock could test its low around $12 from December of last year in fairly short order.
Near-term Keys: The stocks’ current momentum means that even an aggressive and speculative short-term trader would be foolish to consider buying HPE, or using call options to bet on a near-term increase in price. Placing a bearish trade, using put options or shorting the stock might be tempting, but is really a case in my opinion of trying to “scrape the bottom of the barrel” for whatever might be left between $12 and $13 per share. There isn’t a lot of profit potential in that kind of bet. The current state of industrywide uncertainty makes it hard to say that it’s a great time to consider HPE as a long-term position, despite its improving fundamentals and ever-improving bargain argument. That said, if you aren’t afraid of continued uncertainty, including the very real possibility of continued price volatility through the rest of the year, the long-term potential does appear to be much higher than the near-term risk. A patient value-oriented investor will, at the very least, start watching this stock more closely for signs of improving conditions that might encourage the market to give the stock a new push to the bullish side, and be ready to take a position at that point.