Market volatility has come back in a big way over the last two days. I don’t think it should be all that surprising, given the way that trade and tariffs have dominated market commentary for most of the last year and a half. Even as officials from both the U.S. and China resumed negotiations last week, Trump pushed trade uncertainty – not hope – back to the forefront of investor’s attention by announcing his intention to impose yet another set of 10% tariffs on what remaining Chinese goods had not yet been included in previous taxable goods lists. The Chinese yesterday responded with retaliation of their own, meaning that yet again both sides appear to be drawing their own hard lines, with little hope of compromise in the near term to be seen.
Every time trade fear raises its ugly head, bullish investors appear to be more and more on the bleeding edge of market risk – especially if you’re focusing on sectors that are particularly sensitive to global trade. As it relates to China, that generally means that industrial and tech stocks are the most exposed right now, which is why it isn’t too surprising to see tech stocks like KLA-Tencor Corporation (KLAC), Applied Materials (AMAT), and LAM Research Corp (LRCX) – companies that provide products and services including fabrication and manufacturing to the semiconductor industry – each down around -10% in just the last two days.
The semiconductor industry has been one of the most volatile in the market since the beginning of 2018. Like much of the market, semis have done relatively well in 2019 – even as it has dropped nearly -11% since the last week of July, the industry is still up more than 23% year to date (as measured by the Philadelphia Exchange Semiconductor iShares ETF (SOXX). That recent big drop, which has really accelerated in the last two days, however, has pushed the industry back near to the level it back 2018 at, implying that trade uncertainty could bleed into risk of a decline to bear-market levels.
LRCX’s performance since late July has matched the industry’s decline; after hitting a 52-week high at around $218.50 in lat July, the stock has dropped back to around $193, marking a short-term decline of about -11.5%. It is reasonable to suggest that in the near term, bearish risk is high in stock; but does the stock’s slide in just the last couple of weeks also mean a smart value investor could start to look for an opportunity to jump in, or is it smarter to wait? You decide.
Fundamental and Value Profile
Lam Research Corporation is a supplier of wafer fabrication equipment and services to the semiconductor industry. The Company designs, manufactures, markets, refurbishes and services semiconductor processing systems that are used in the fabrication of integrated circuits (ICs). It operates through manufacturing and servicing of wafer processing semiconductor manufacturing equipment segment. Its products are designed to enable its customers build a range of devices that are used in a range of electronic products, including cell phones, tablets, computers, storage devices, and networking equipment. Its customer base includes semiconductor memory, foundry, and integrated device manufacturers (IDMs) that make products, such as dynamic random-access memory (DRAM), negative-AND (NAND) memory and logic devices. It offers a portfolio of products that are used in several areas of the semiconductor manufacturing process flow, including thin film deposition, plasma etch and single-wafer clean. LMC’s current market cap is $29 billion.
Earnings and Sales Growth: Over the last twelve months, earnings declined almost -32% while revenues dropped a little over -24%. In the last quarter the both areas declined, but at a slowing pace, with earnings dropping by -2.16% and sales decreasing by -3.19%. LMC operates with a very strong and stable margin profile, with Net Income running at nearly 23% of Revenues over the last twelve months as well as the last quarter. This stable operating profile has held firm throughout 2019.
Free Cash Flow: LMC’s free cash flow is healthy, at nearly $2.9 billion and which translates to a useful Free Cash Flow Yield of 9.89%.
Debt to Equity: LMC has a debt/equity ratio of .82. This is a generally conservative number, supported by the cash and liquid assets that, at $5.4 billion are well above long-term debt, which was $3.8 billion in the last quarter. It is worth noting that in the last quarter of 2018, long-term debt was just $1.6 billion. Despite the increase in debt, their very impressive operating margins and still very strong cash position means that the company has both the ability to service their debt without difficulty, and superior liquidity and financial flexibility.
Dividend: LMC pays an annual dividend of $4.40 per share, which translates to a yield of about 2.27% at the stock’s current price.
Price/Book Ratio: there are a lot of ways to measure how much a stock should be worth; but one of the simplest methods that I like uses the stock’s Book Value, which for LMC is $31.27 (a notable decline from $34.26 at the end of 2018) and that translates to a Price/Book ratio of 6.2 at the stock’s current price. The declining Book Value is a significant red flag that the market has to this point mostly ignored, but that could signal continued fundamental risk ahead. When you compare it to their historical Price/Book ratio, it also suggests the stock is overvalued by nearly -50% right now. A counter to that argument is that the stock is current trading a little more than 16% below its historical Price/Cash Flow ratio. The difference between the long-term target prices these ratios offer is very wide, which is something I take as a negative and prompts me to lean heavier on the overvalued side of the question.
Technical Profile
Here’s a look at the stock’s latest technical chart.
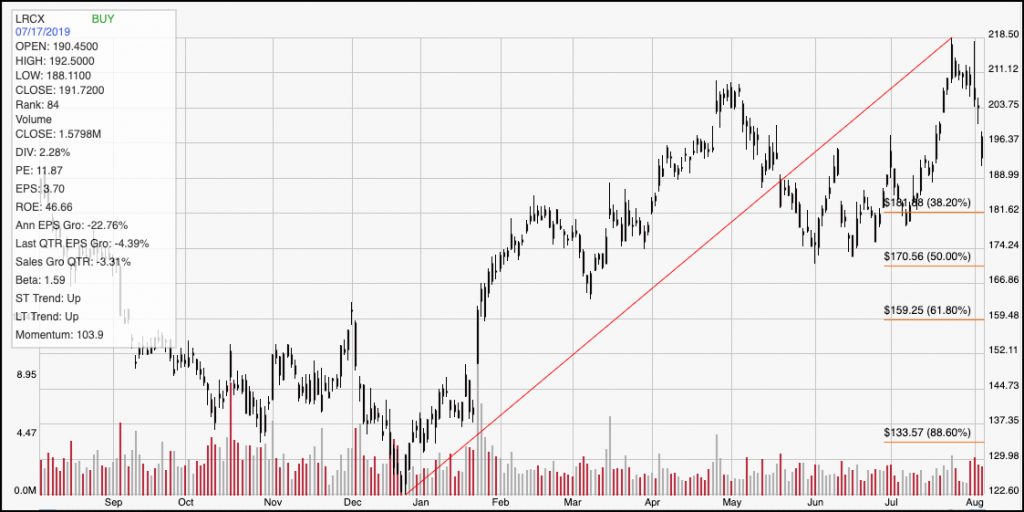
Current Price Action/Trends and Pivots: The red diagonal line measures the length of the stock’s upward trend from the beginning of the year to the latter part of July. It also informs the Fibonacci retracement lines shown on the right side of the chart. The stock’s drop over the last two days is really just an acceleration of a decline that started a couple of weeks ago, and has the stock nearing its 38.2% Fibonacci retracement line at around $182 per share – about $11 away from its current price. Any kind of stabilization between the stock’s current price and $182 should be taken as a bullish sign, inviting an opportunity to “buy the dip” for short-term traders; however if the stock breaks that support, and falls below $181, it could easily drop to anywhere between the levels marked by the 50% and 61.8% retracement lines, which puts near-term downside at that point between $11 and $22 per share.
Near-term Keys: If you’re looking for a short-term bullish trade, and you’re willing to be aggressive, you could use any kind of a bullish bounce between the stock’s current level and $182 as a signal to buy the stock or work with call options, with a near-term target somewhere between $204 and $218 acting as a pretty useful target point. While I think bearish risk is increasing, a useful trading signal, providing a high-probability bearish entry, won’t really be seen unless the stock drops below $181. If that happens, it would be smart to consider shorting the stock or working with put options with an eye on $170 as an immediate short-term target price. The truth is that while I like most of LRCX’s fundamentals, there are enough concerns – increasing debt, negative earnings, and declining intrinsic value – that I don’t think there is any kind of useful value-based case to be made at these price levels.