Cisco Systems Inc. (CSCO) is one of the most recognizable and established companies in the Technology sector. With a market cap of nearly $200 billion, they are also one of the largest, if not THE largest player in the Networking & Communications segment. They are, without question, the standard that all other networking businesses are measured and compete against. No matter whether you’re talking about wired or wireless networking, CSCO is one of the companies that not only developed the standards and infrastructure the entire Internet is built on today, but that continues to lead the way into the future, including the next generation of technology in the so-called “Internet of Things” (IoT).
It’s ironic, perhaps that despite CSCO’s unquestioned dominance in its market, the stock has mostly languished for nearly two decades. After riding the “dot-com boom” of the late 1990’s to a peak at around $80 per share, the stock cratered when that boom went bust, dropping to as low as about $8 in late 2002. From that point it never rose higher than into the low $30 range – at least not until the latter part of 2017, when the stock finally broke that top-end resistance. That pushed the stock to a high in May a little above $46 per share as Tech stocks generally prospered. 2019 has been good for the investors in the stock, as well; the stock is up 30% from its late December 2018 low around $40 per share, and hit a new multi-year high a little above $58 in mid-July.
From that high, however, the stock has suffered the effect of new tensions on the trade front that have pounded the entire tech sector. The stock has dropped a little over 10% from that high, with most of that drop coming in just the last four days. The question at this point for a stock like CSCO – one of the unquestioned “600-lb gorillas” of tech stocks is whether that drop invites a new opportunity to “buy the dip.”
While I recognize CSCO’s dominance in its industry, expect it to continue, and recognize the company’s core fundamental strength, my reliance on value analysis also forces me to look at the stock’s current price in more conservative terms. It looks very overvalued right now. The company is due for its latest earnings report in just about a week, and that report could alter my perspective somewhat; but as of now I have to believe, given the strongly bearish momentum the sector is showing, and the reality that there is no sign of trade peace in sight, that the stock is at a greater risk of a steeper decline than it is of staging a rebound to test its recent highs. Here’s what I mean.
Fundamental and Value Profile
Cisco Systems, Inc. (CSCO) designs and sells a range of products, provides services and delivers integrated solutions to develop and connect networks around the world. The Company operates through three geographic segments: Americas; Europe, the Middle East and Africa (EMEA), and Asia Pacific, Japan and China (APJC). The Company groups its products and technologies into various categories, such as Switching; Next-Generation Network (NGN) Routing; Collaboration; Data Center; Wireless; Service Provider Video; Security, and Other Products. In addition to its product offerings, the Company provides a range of service offerings, including technical support services and advanced services. The Company delivers its technology and services to its customers as solutions for their priorities, including cloud, video, mobility, security, collaboration and analytics. The Company serves customers, including businesses of all sizes, public institutions, governments and service providers. CSCO has a market cap of $224.1 billion.
Earnings and Sales Growth: Over the last twelve months, earnings grew by 18.33%, while sales growth was more modest, at about 4%. Growing earnings faster than sales is hard to do, and generally not sustainable in the long-term; however it is also a positive mark of management’s ability to maximize their business operations. In the most recent quarter, earnings grew about 6% while sales growth was a little above 4%. CSCO has a very strong operating profile, with Net Income running at 25.7% of Revenues over the last twelve months and declining only slightly in the last quarter to about 23.4%.
Free Cash Flow: CSCO’s free cash flow over the last twelve months is more than $15 billion. This is a number that the company has historically managed to maintain at very healthy levels and translates to a Free Cash Flow Yield of 6.7%.
Debt to Equity: CSCO has a conservative, manageable debt-to-equity ratio of .43. CSCO’s balance sheet shows more than $34.6 billion in cash and liquid assets versus a little under $16 billion in long-term debt. Servicing their debt is not a concern, and liquidity to pursue additional expansion or return value to shareholders via stock buyback or increased dividends is excellent.
Dividend: CSCO currently pays an annual dividend of $1.4 per share, which translates to an annual yield of about 2.67% at the stock’s current price.
Price/Book Ratio: there are a lot of ways to measure how much a stock should be worth; but one of the simplest methods that I like uses the stock’s Book Value, which for CSCO is $7.64 per share; this is where the biggest cracks in the bargain argument really exist. At the stock’s current price, its Price/Book ratio, at 6.85, is more than twice as high as its historical average of 2.9; a drop to par with that average puts the stock at risk of a decline of more than -57% (around $22.15 per share) from its current price. That would also put the stock at price levels it hasn’t seen since early 2016. Working with the stock’s Price/Cash Flow ratio is somewhat more favorable, but still shows significant downside risk, since the stock is -33.5% above its historical average, providing a “fair value” target at around $35 per share.
Technical Profile
Here’s a look at the stock’s latest technical chart.
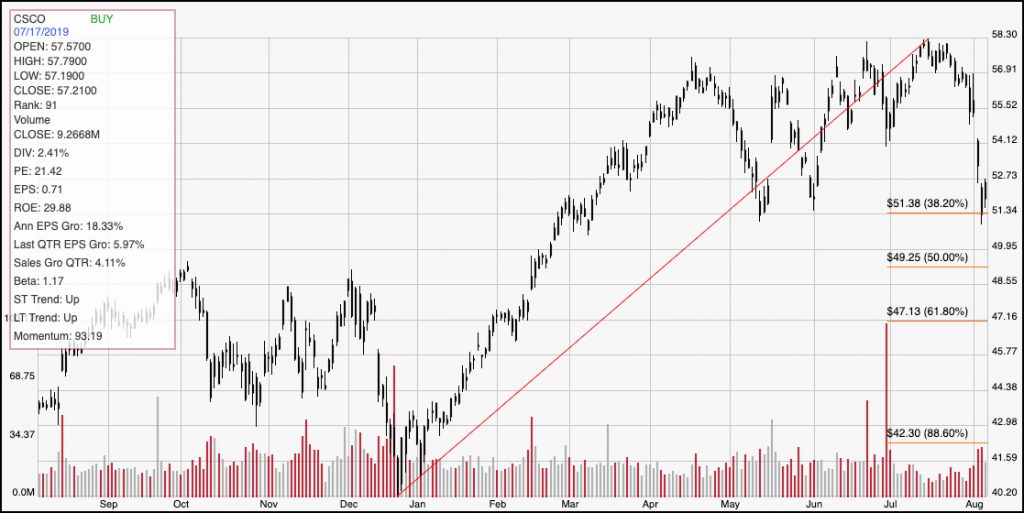
Current Price Action/Trends and Pivots: The diagonal red line traces the stock’s upward trend from late December 2018 to mid-July and provides the reference for calculating the Fibonacci retracement levels indicated by the horizontal red lines on the right side of the chart. The stock’s decline from that point has followed a rapid, steep slope, which is a strong sign of the heavily bearish sentiment and momentum that the entire tech sector is dealing with right now. In the last couple of days, the stock does appear to have found short-term support a little above $51, as shown by the 38.2% Fibonacci retracement line. If the stock can rebound through the end of the week from that point, it could push back to somewhere between $56 and $58, and even retest its all-time high from July a little above $58. If the stock drops below $51, I would expect it drop to around $48 (around its highest levels in late 2018) before finding support between $47 and $48.
Near-term Keys: “Buying the dip” right now looks tempting, but it is also a pretty aggressive move, and when the potential long-term opportunity is overwhelmed by the potential downside risk as CSCO’s valuations demonstrate, it’s hard to say that’s a good decision to make. If you prefer to work with short-term trading strategies, the stock could offer an interesting momentum-based opportunity, if the stock can hold support at around $51 and even keep building more of a consolidation base around its current level, to buy the stock or work with call options with an eye on the $56 to $58 target area. A drop below $51, on the other hand could be an interesting signal to short the stock or work with put options with an eye on the $47 level as a short-term exit target for a bearish trade.