The energy sector is one of the most cyclical sectors of the economy, primarily because of its reliance on oil. Oil prices are often highly volatile depending any number of factors, ranging from geopolitics to weather phenomenon to simply supply and demand. A good example of that volatility was seen in the latter part of 2014, when oil prices dropped from above $100 per barrel to a low in early 2016 around $27. That put a lot of pressure on the entire energy sector, and the oil industry in particular, driving oil producers as well as the companies that provide equipment and services to them into their own extended bear market.
A rally until late last year pushed oil prices near to the $80 per barrel mark that was fueled by continued high consumer demand and also by supply concerns. The supply of West Texas Intermediate (WTI) crude was constrained through a big portion of last year and into this year by pipeline capacity limitations in the Permian Basin, where most of the biggest supply of U.S. shale oil comes from. Producers in the basin have produced more oil than current pipelines can transport to the Gulf of Mexico. There are several projects underway to build more pipeline capacity, but most of those projects are not expected to even approach completion until late this year at the earliest and into 2020.
Pressures that have added to the volatility of oil prices in the last few months have included the ongoing trade war between the U.S. and China as well as geopolitical tensions in Iran, where re-imposed sanctions by the U.S., along with Iran’s reaction including attacks on tankers in the Persian Gulf. The spread between U.S. crude (WTI) and oil from the Middle East (Brent), which is usually between $7 and $9 per barrel, has been shrinking since the end of July, as Brent has dropped below $60 per barrel. As of this writing, the spread has dropped to about $3.50 per barrel – its lowest difference since July of 2018.
At the end of 2018, oil prices and oil stocks followed the broad market lower, with WTI crude dropped to around $50 per barrel and stocks like Halliburton Co. (HAL) extending downward trends into a long-term timeframe. HAL is the largest provider of services and equipment to the oil sector in the United States, and the 2nd largest in the world, behind only Schlumberger N.V. (SLB). Their stock price has dropped since the beginning of 2018 from a high at around $58 to a low point in December near $25 per share. After rallying briefly in April to about $31, the stock has dropped back amid pressures from the trade war between the U.S. and China and geopolitical tensions in Iran and is forging new lows right now around $19.
The decreasing spread between Brent and WTI crude could be a positive for stocks like HAL, who generated about 60% of its revenues from North America, is a reflection of increasing U.S. imports in parts of the world that have been forced by sanctions on Iranian crude to buy more from the U.S., and that could be a good thing. Does that mean that stocks like HAL, which are trading at a steeper discount than ever, are an opportunity you should pay more attention to?
Fundamental and Value Profile
Halliburton Company provides services and products to the upstream oil and natural gas industry throughout the lifecycle of the reservoir, from locating hydrocarbons and managing geological data, to drilling and formation evaluation, well construction and completion, and optimizing production throughout the life of the field. It operates through two segments: the Completion and Production segment, and the Drilling and Evaluation segment. The Completion and Production segment delivers cementing, stimulation, intervention, pressure control, specialty chemicals, artificial lift and completion services. The Drilling and Evaluation segment provides field and reservoir modeling, drilling, evaluation and wellbore placement solutions that enable customers to model, measure, drill and optimize their well construction activities. It serves national and independent oil and natural gas companies. As of December 31, 2016, it had conducted business in approximately 70 countries around the world. HAL has a current market cap of about $17 billion.
Earnings and Sales Growth: Over the last twelve months, earnings decreased by more than -39.5%, while revenues also negative at -.3.5%. In the last quarter, earnings improved by 52% while sales increased a little above 3%. HAL’s margin profile is a concern, since it has been narrowing significantly throughout the year. In the last twelve months, Net Income as a percentage of Revenues was 5.57%, but was only 1.26% in the last quarter.
Free Cash Flow: Like Net Income, HAL’s free cash flow is declining significantly, at $415 million – a drop of about -$900 since the end of the first quarter of this year. From a Free Cash Flow Yield standpoint, that translates to just 2.42%.
Debt to Equity: HAL’s debt to equity is a bit high at 1.16 and has increased in the last quarter. The company’s balance sheet shows a little over $1.1 billion in cash and liquid assets – down from $2 billion earlier this year – against about $11 billion in long-term debt. The company should have no problem servicing their debt for the time being; but given their deteriorating Net Income and Free Cash Flow, it isn’t unreasonable to wonder if HAL could see liquidity difficulties in the near term.
Dividend: HAL’s annual divided is $.72 per share, which translates to a yield of about 3.7% at the stock’s current price.
Price/Book Ratio: there are a lot of ways to measure how much a stock should be worth; but one of the simplest methods that I like uses the stock’s Book Value, which for HAL is $10.87 and translates to a Price/Book ratio of 1.79 at the stock’s current price. The stock’s historical average Price/Book ratio is 3.22, which puts a target price for the stock at about $35 per share. That is a little more than 79% above the stock’s current price, which is very attractive by itself. Using the company’s Free Cash Flow, however, the picture does signal more risk, since the stock is actually trading -62% above that historical average. Given the fundamental concerns I just listed, along with continuing geopolitical and trade concerns, I think there is more risk the stock will continue to decline than there is near-term opportunity.
Technical Profile
Here’s a look at the stock’s latest technical chart.
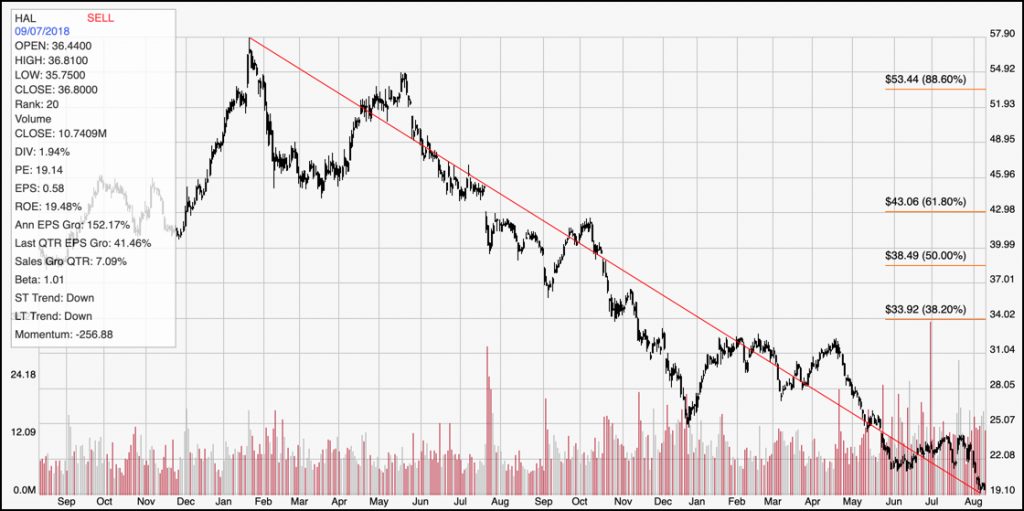
Current Price Action/Trends and Pivots: The chart above covers the last two years of price activity. The red diagonal line traces the stock’s downward trend since January 2018 to its lowest point reached just last week. That line also informs the Fibonacci retracement lines shown on the right side of the chart. The stock has shown significant weakness since June, and it has accelerated in the last couple of weeks. The stock is now at levels it hasn’t seen since the end of the last bear market in 2009, and if it can’t hold support around $19, it could easily drop to between $15 and $16 per share.
Near-term Keys: Unfortunately, HAL doesn’t look like a good risk right now – unless you are willing to work with an increasingly long-term outlook. As pipeline projects in the Permian basin come online, the flow of crude out of that region will increase, which will be a positive for HAL, and so that does mean that the fundamental concerns that exist right now are probably temporary. Given the current level of uncertainty from trade and Mideast tensions, however I think the stock is over-sensitive to increased price weakness right now. I would prefer to see Net Income start to increase on a quarterly basis, along with Free Cash Flow and net cash and liquid assets before considering a long-term trade. If the stock breaks below $19, there could be an opportunity to short the stock or work with put options with an eye on $16. If you want to be aggressive, a bounce off of support at $19, and a push to about $20 could offer an opportunity to buy the stock or work with call options, with a near-term target at around $23 at the stock’s recent pivot high in late July; but I think that is a very low-probability trade.