As trade concerns have introduced volatility back into the market, industrial and technology stocks in particular have been battered the worst. It is true that many of the companies in these sectors have been referring to tariffs and trade among headwinds to their latest earnings results. That is among the reasons that the Industrial sector, for example, as measured by the S&P 500 Industrial Sector SPDR ETF (XLI) is down a little over -5% in the last month. That decline extends to the entire market, as all of the major market indices are down about the same amount from their most recent highs.
Among Industrial stocks, one company that I’ve followed quite a bit is Oshkosh Corp (OSK), a manufacturer of specialty vehicles that are marketed in particular in military, fire and defense, access equipment, and commercial settings. Over the last month, the stock has dropped more than -16.5% but is still up 16% year to date. Does this recent decline mark an opportunity to open a new position in a company with a solid set of fundamental measurements? Let’s find out.
Fundamental and Value Profile
Oshkosh Corporation (OSK) is a designer, manufacturer and marketer of a range of specialty vehicles and vehicle bodies, including access equipment, defense trucks and trailers, fire and emergency vehicles, concrete mixers and refuse collection vehicles. The Company’s segments include Access Equipment; Defense; Fire & Emergency, and Commercial. The Access Equipment segment consists of the operations of JLG Industries, Inc. (JLG) and JerrDan Corporation (JerrDan). The Defense segment consists of the operations of Oshkosh Defense, LLC (Oshkosh Defense). The Fire & Emergency segment consists of the operations of Pierce Manufacturing Inc. (Pierce), Oshkosh Airport Products, LLC (Airport Products) and Kewaunee Fabrications LLC (Kewaunee). The Commercial segment includes the operations of Concrete Equipment Company, Inc. (CON-E-CO), London Machinery Inc. (London), Iowa Mold Tooling Co., Inc. (IMT) and Oshkosh Commercial Products, LLC (Oshkosh Commercial). OSK has a current market cap of about $5 billion.
Earnings and Sales Growth: Over the last twelve months, earnings grew by 23%, while revenue increased almost 10%. In the last quarter, earnings grew 45.5% while sales increased 20%. Growing earnings faster than sales is difficult to do, and is generally not sustainable in the long-term; but it is also a positive mark of management’s ability to maximize its business operations effectively. The company operates with an operating margin that has historically been stable, and is improving; over the last twelve months, Net Income was about 7.04% of Revenues. This number increased somewhat in the last quarter to a little above 8%.
Free Cash Flow: OSK’s free cash flow is adequate, at about $205 million. This number has is slightly lower since the middle of last year, from $253 million.
Dividend: OSK’s annual divided is $1.08 per share, which translates to a yield of 1.52% at the stock’s current price. That also marks an increase from $.96 per share, per annum around the middle of last year.
Price/Book Ratio: there are a lot of ways to measure how much a stock should be worth; but one of the simplest methods that I like uses the stock’s Book Value, which for OSK is $37.97 and translates to a Price/Book ratio of 1.87 at the stock’s current price. The stock’s historical average Price/Book ratio is 2.08, meaning that the stock is only about 11% below that average. That doesn’t sound like there is much room to grow; but another measurement that I like to use to complement my analysis is the stock’s Price/Cash Flow ratio. In the case of OSK, the stock is trading more than 75% below its historical Price/Cash Flow ratio. That suggests the long-term target price for the stock is well above $100 per share, and above the stock’s 2018 high.
Technical Profile
Here’s a look at the stock’s latest technical chart.
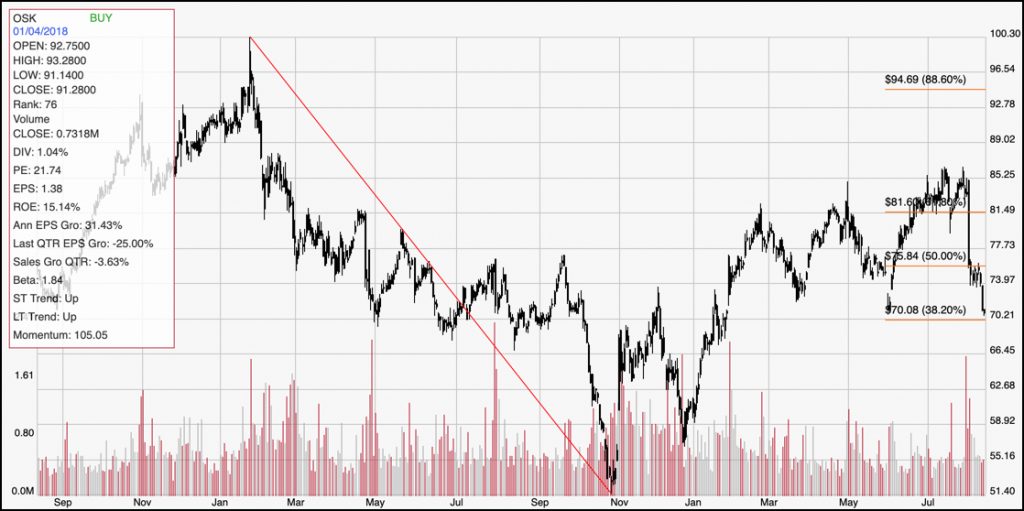
Current Price Action/Trends and Pivots: The red diagonal line measures the length of the stock’s downward trend from $100 at the beginning of 2018 a year ago until the beginning of November when it bottomed around $51; it also informs the Fibonacci trend retracement lines shown on the right side of the chart. The stock’s upward trend from that point is clear, as the stock pushed to a high in late July at around $85. In just the last couple of weeks, however, the stock’s momentum has turned clearly bearish, pushing it down to strong support in the $70 price area and near to the 38.2% retracement line. A drop below that point could see the stock drop to somewhere between $63 and $65 per share before it finds new support. A near-term reversal of the stock’s current bearish momentum could be seen with a break above $74 per share.
Near-term Keys: OSK’s current levels may not mark an ideal value opportunity, but there is an interesting case to be made for the stock to revisit the top end of the highs it visited at the beginning of 2018. The stock’s current decline and bearish momentum puts the stock at risk of more extended declines, which means that if you do choose to take a value-based position, you need to be willing to accept the likelihood of continued price volatility. If you prefer to work with short-term opportunities, the stock could offer an interesting bearish, momentum-based trade if it breaks below $70 per share. That could provide a useful signal to short the stock or work with put options with an exit target price at around $65 per share. If, however the stock manages to break above $74, there could be an interesting opportunity to buy the stock or work with call options with an upside target price at around $81.