There are a lot of ways to look at a company and evaluate them for fundamental strength. Traditional metrics, including many of the ones that I rely on for the stocks that I analyze, measure everything from sales and earnings growth to how much productivity the company realizes per employee. You can break down the type of debt a company carries, how much of their available cash reserves is readily available, what percentage of earnings is paid out to shareholders in the form of dividend and/or stock buybacks, and so on. The types of fundamentals tools you can tap into are nearly as abundant as the types of technical indicators you can use to measure a stock’s price.
Part of the purpose for conducting a thorough fundamental analysis is to estimate how much risk you might be taking when you invest your hard-earned dollars into a stock. That evaluation can also go quite a bit beyond just the fundamental measurements of the stock itself. Where the company does business, how localized or global their operations are, for example, are easy ways to identify whether you’re working with a relatively small business or a major player in a respective industry. Generally, the broader the scope a company’s business operations is, the less risky it should be, since when operations in one region might ebb, they may flow in another one.
Caterpillar Inc. (CAT) is a good example. CAT isn’t just one of the most recognizable U.S. companies in the entire stock market; of stocks in the Industrial sector, they are probably the most widely known, since their heavy equipment is seen in construction and mining settings all over the world. That is almost always seen as a strength, but against the backdrop of a slowing global economy, tariffs and long-term trade tensions between the U.S. and its largest trading partners and pricing pressures from currency exposure related to oil supply and demand amidst geopolitical uncertainty in the Middle East, companies like CAT have suffered. While the Industrial sector is up nearly 17% year to date as measured by the S&P 500 Industrial Sector SPDR ETF (XLI), CAT is down -14% over the same period. Most of that drop has come in just the last month, as the stock has dropped from a near-term peak at around $136 to its current level around $115. Does the drop present a new opportunity, or is it a sign that the worst isn’t over, and the smarter choice right now is to wait? Let’s look.
Fundamental and Value Profile
Caterpillar Inc. is a manufacturer of construction and mining equipment, diesel and natural gas engines, industrial gas turbines and diesel-electric locomotives. The Company operates through segments, including Construction Industries, which is engaged in supporting customers using machinery in infrastructure, forestry and building construction; Resource Industries, which is engaged in supporting customers using machinery in mining, quarry, waste and material handling applications; Energy & Transportation, which supports customers in oil and gas, power generation, marine, rail and industrial applications, including Cat machines; Financial Products segment, which provides financing and related services, and All Other operating segments, which includes activities, such as product management and development, and manufacturing of filters and fluids, undercarriage, tires and rims, ground engaging tools, fluid transfer products, and sealing and connecting components for Cat products. CAT’s current market cap is $65 billion.
Earnings and Sales Growth: Over the last twelve months, earnings declined by almost -5%, while sales increased modestly, by 3%. In the last quarter, earnings dropped a little under -4%, while sales grew by 7%. Despite the unfavorable earnings pattern, the company operates with a sturdy, stable operating profile; over the last twelve months, Net Income was 11.2% of Revenues, and identical in the last quarter.
Free Cash Flow: CAT’s free cash flow is healthy at about $5.4 billion for the last twelve months. This number has increased over the last few quarters, from about $3.2 billion in the third quarter of 2018, and translates to a Free Cash Flow Yield of 8.05%.
Debt to Equity: CAT has a debt/equity ratio of 1.66. This number is higher than I generally prefer to see, but isn’t unusual for Industrial stocks. The company’s balance sheet shows that operating profits are more than adequate to service their debt; in addition, CAT has healthy liquidity with cash and liquid assets in the last quarter of a little over $7.4 billion.
Dividend: CAT pays an annual dividend of $4.12 per share, which translates to a yield of 3.56% at the stock’s current price.
Price/Book Ratio: there are a lot of ways to measure how much a stock should be worth; but one of the simplest methods that I like uses the stock’s Book Value, which for CAT is $26.45 per share and translates to a Price/Book ratio of 4.38 at the stock’s current price. The stock’s historical Price/Book ratio, however is only 3.9, suggesting that stock is about -11% overvalued right now. By comparison, the stock is also trading about 42% below its historical Price/Cash Flow ratio, which means that the baseline “fair value” for the stock is really around $164 per share. Which do you believe, the Price/Book ratio or Price/Cash Flow? I don’t like seeing such a wide discrepancy, so I tend to read it as an indication of increasing risk.
Technical Profile
Here’s a look at the stock’s latest technical chart.
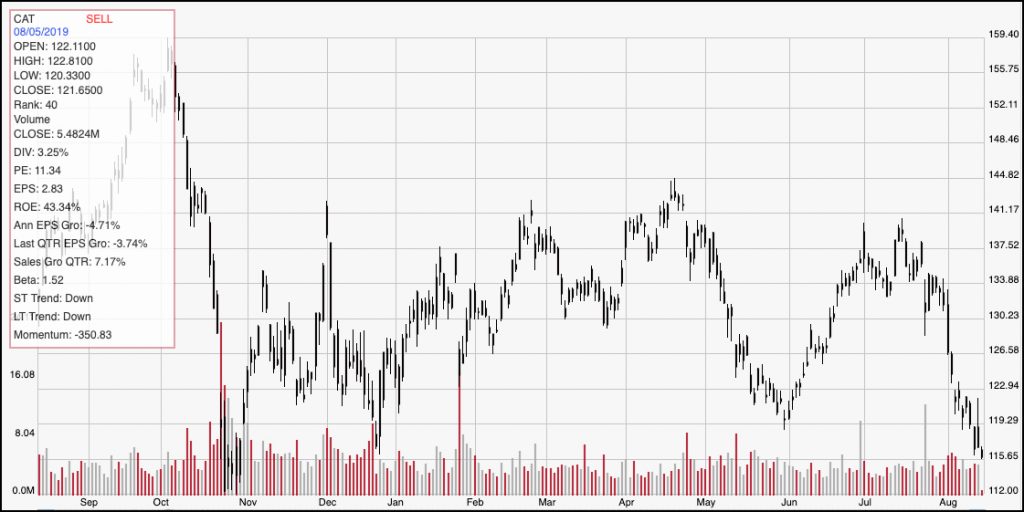
Current Price Action/Trends and Pivots: The chart above outlines the stock’s movement over the past year. The stock’s decline since mid-July is notable, and has pushed the stock only a few dollars above its 52-week low point at around $112 per share. Its current momentum suggests that it isn’t likely to find support until at least the $112 level; if support doesn’t hold at that point, the stock could drop to somewhere between $105 and $107 before it finds support again. That would also push the stock into price ranges it hasn’t seen since the latter part of 2017. Immediate resistance for the stock is currently at around $119, based on pivot low in late May; given the strength and pace of bearish momentum, it would need to break above that level at least before I would begin looking for any indication of a short-term upward trend reversal.
Near-term Keys: Trying to find a short-term bullish trade with CAT is a fools’ game right now; the stock could begin to stabilize and establish new support around $112, but the fact is that is a very low-probability scenario right now. It is far more likely that, even if the stock does attempt a temporary rally from its current level, it will resume the path set by its bearish momentum through the month. If you don’t mind being very speculative, you could take a push above $119 as a signal to buy the stock or work with call options with an exit target price between $123 and $125 per share. A bearish trade would also need a push below $112 as a useful signal the current downward trend is likely to continue. That would provide a good opportunity to consider shorting the stock or working with put options with a near-term target price at around $105 per share. What about the value proposition? CAT has a lot of fundamental strength working in its favor right now, but I think that right now there are too many outside pressures – tariffs, geopolitics, and so on as previously described – that are going to keep investors on edge when it comes to Industrial stocks. I think the smarter decision is to wait for the stock to stabilize before you consider a long-term investment based on the Price/Cash Flow value argument.