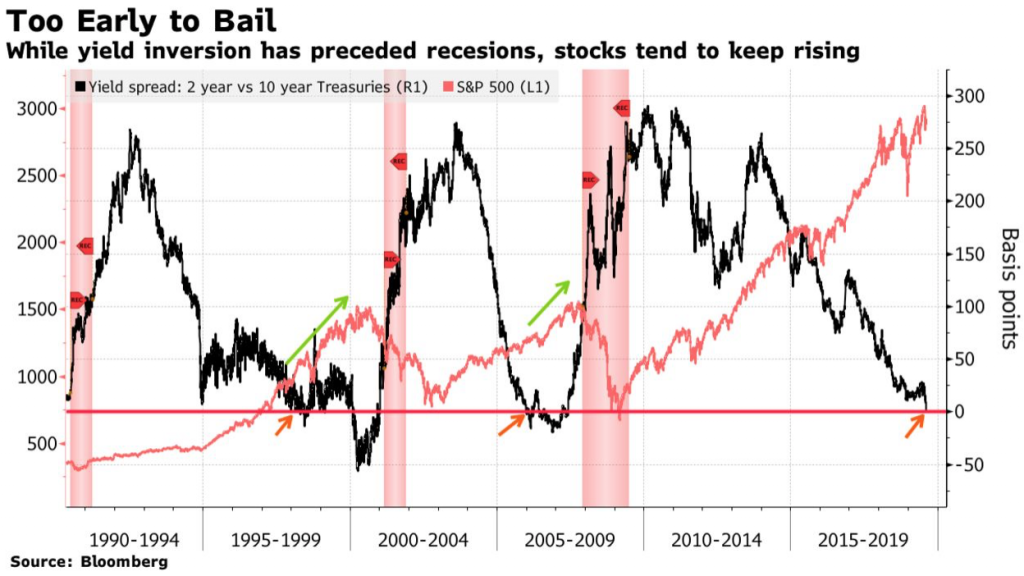
The dreaded yield curve inversion has arrived, and investors are spooked. But history says the market still has some time left to rally…
The clock is ticking.
“The U.S. equity market is on borrowed time after the yield curve inverts,” said Bank of America strategist Stephen Suttmeier.
And invert it has. Early Wednesday morning, the yield curve between the 2-year and 10-year Treasury notes inverted, sending futures reeling as traders began betting this inversion was the reliable recession indicator the market has been watching for for months.
But while an inversion of the yield curve has been a big worry for traders since late last year and was seemingly the only thing on the minds of market participants today, history shows that stocks still have some time left.
Historically, stocks have another 18 months to rally after an inversion before equity markets begin to see significant signs of trouble.
Strategists began publishing research on yield curve data last summer when rising short-term rates started to narrow the spread between the 3-month and the 10-year yield to levels that hadn’t been seen since the financial crisis. That curve eventually inverted, but stocks have since continued to rally to new highs.
But now, we’ve got the main event. The yield curve between the 2- and 10-year notes—which is the market’s preferred curve to watch—has inverted in an ominous sign for the economy and stock market.
According to data gathered by Bank of America, the spread between the 2- and 10-year yields has turned negative 10 times going back to 1956, with the S&P 500 topping out anywhere from two months to two years later. And investors who bailed immediately after an inversion have historically lost out on double-digit gains.
“It’s a great recession indicator,” said Canaccord Genuity chief market strategist, Tony Dwyer. “It just happens to work with a lag. Acting on it now is inappropriate.”

This signal from the bond market has preceded each of the last seven recessions. In six of the last ten times the yield curve has inverted, the S&P 500 began to roll over within three months. In the other four occasions, stocks didn’t top out until at least eleven months had passed, according to Bank of America.
Suttmeier noted that the S&P 500 “can take time to peak after a yield curve inversion,” which certainly clouds investors’ thinking around how to handle the inversion when allocating portfolios.
“Sometimes the S&P 500 peaks within two to three months of a 2s10s inversion but it can take one to two years for an S&P 500 peak after an inversion,” Suttmeier added. “The typical pattern is the yield curve inverts, the S&P 500 tops sometime after the curve inverts and the U.S. economy goes into recession six to seven months after the S&P 500 peaks.”
“After the initial drawdown, the S&P 500 can have a meaningful last gasp rally,” Suttmeier concluded.
The S&P 500 has typically fallen roughly -5% in the immediate aftermath of an inverted yield curve, and the index was down nearly -3% today alone. But comebacks have been strong, with stocks historically rallying 17% on average in the 7 months following the initial negative reaction, according to the Bank of America’s analysis.
Still, timing the market isn’t easy. The question investors should ask themselves now is if they can handle what could be a wild ride over the next few months and if they’ll be able to sleep soundly at night if they stay in the market to cash in on that “last gasp rally.”