Uncertainty since mid-July in the broad market has put a lot of pressure on stocks in a lot of industries – and if the analysts are to be believed, sectors that are the most exposed to trade pressures and sensitive to the cyclical nature of economic ebb and flow, like Technology and Industrials are at the greatest risk. Volatility certainly does seem to be the name of the game yet again, and so that does mean that a smart investor has to be selective and careful about the stocks you choose to work with.
Volatility means that a stock’s price swings from high to low are more likely to be greater than normal, and that can translate to wide emotional swings that not all investors have either the experience or the knowledge to manage successfully. It also means, however that if you know what to look for, you can find an increasing number of stocks in these “sensitive” sectors and industries that, while they may be experiencing swings to the low side of their historical ranges, also sport business profiles that suggest the stock should be priced much higher than it is now. That is the essence of value-oriented investing, and it is a good way to find opportunity in the midst of what most investors would think of as utter chaos.
Borgwarner Inc. (BWA) is an example of a stock that is plumbing the extreme low end of its price range over the last two years; in fact, the pressures I just mentioned have pushed the stock down -23.5% in just the last three weeks to set a new multiyear low at the end of last week a little below $31 per share. At the beginning of this week, however, the market seems to take courage from what many surely hope are signs of thawing in U.S.-China trade talks. That includes an apparent extension of a reprieve on penalties, at least temporarily by the Trump administration on companies doing business with Chinese tech giant Huawei that gave the market a reason to give the market a nice bump to start the week.
While an actual deal isn’t expected at any point this year, it is also true that most investors are likely to treat any legitimate sign of progress on trade as a reason to boost stocks in general; that is something that I would expect to work in the favor not only of tech stock but also severely depressed industrial stocks like BWA. As a company that supplies the entire automative sector, which is very sensitive to trade, progress on this front should work strongly in their favor. In the meantime, this is a company with a solid fundamental profile and an increasingly attractive bargain story. Here it is.
Fundamental and Value Profile
BorgWarner Inc. is engaged in providing technology solutions for combustion, hybrid and electric vehicles. The Company’s segments include Engine and Drivetrain. The Engine segment’s products include turbochargers, timing devices and chains, emissions systems and thermal systems. The Engine segment develops and manufactures products for gasoline and diesel engines, and alternative powertrains. The Drivetrain segment’s products include transmission components and systems, all-wheel drive (AWD) torque transfer systems and rotating electrical devices. The Company’s products are manufactured and sold across the world, primarily to original equipment manufacturers (OEMs) of light vehicles (passenger cars, sport-utility vehicles (SUVs), vans and light trucks). The Company’s products are also sold to other OEMs of commercial vehicles (medium-duty trucks, heavy-duty trucks and buses) and off-highway vehicles (agricultural and construction machinery and marine applications. BWA has a current market cap of about $6.7 billion.
Earnings and Sales Growth: Over the last twelve months, earnings decreased a little over -15%, while revenues dropped about -5.3%. In the last quarter, earnings were flat while sales were flat but slightly negative by -0.5%.. The company’s margin profile shows that Net Income as a percentage of Revenues over the last twelve months were 7.53%, but weakened slightly in the last quarter to 6.74%. If you take each Net Income figure by itself, these aren’t terrible numbers; but the negative pattern is reflective of the effect of trade on the auto industry in general, and is a reason that there could continue to be quite a bit of negative pressure on auto stocks in general.
Free Cash Flow: BWA’s free cash flow is healthy and improving, at $761.3 million. This number marks an improvement from the beginning of the year of almost $200 million, and since the quarter prior when it was $629.5 million. This also translates to a useful, strengthening Free Cash Flow Yield of 11.5%.
Debt to Equity: A has a debt/equity ratio of .43. This is a very manageable number, that suggests the company should have no trouble servicing their debt. Their balance sheet shows $710 million in cash and liquid assets against about $1.9 billion in long-term debt. Both of these numbers have also improved since the end of 2018, which is a useful counter to the negative pattern in earnings growth and the modest drop in Net Income.
Dividend: BWA’s annual divided is $.68 per share and translates to a yield of 2.13% at the stock’s current price.
Price/Book Ratio: there are a lot of ways to measure how much a stock should be worth; but one of the simplest methods that I like uses the stock’s Book Value, which for BWA is $21.80 and translates to a Price/Book ratio of 1.49 at the stock’s current price. Their historical average Price/Book ratio is 2.56, suggesting the stock is currently trading at a major discount of almost 72%. That is supported by the stock’s Price/Cash Flow ratio, which is currently nearly 130% below its average. Together, these provide a very compelling reason to take this stock seriously, with a long-term price of between $55 and $74 per share. That means the stock has some very good fundamental reasons to drive back near to the 52-week highs it saw in 2018.
Technical Profile
Here’s a look at the stock’s latest technical chart.
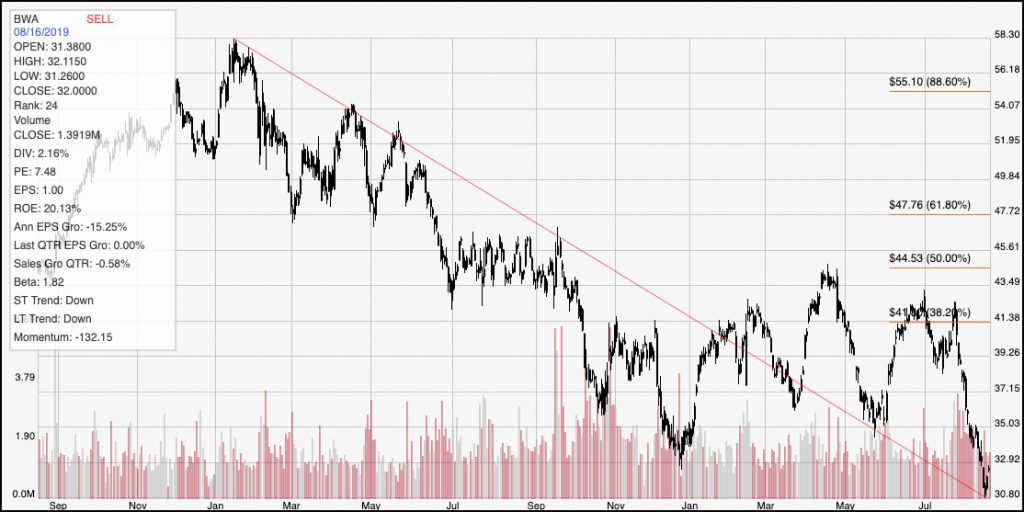
Current Price Action/Trends and Pivots: The red diagonal line measures the length of the stock’s longer-term downward trend, and also informs the Fibonacci trend retracement lines shown on the right side of the chart. The stock’s downward trend through 2018 is easy to see, along with the accelerating pace of the decline over the last few weeks, as the stock dropped from about $41 per share, right around the 38.2% retracement line to its current level a little above $32. The stock appears to be forming a pivot low at around $31; if that is correct, that should provide a good level of support for the stock now, and could even give the stock momentum to push to $35 before finding new resistance. From $35, continued bullish momentum could see the stock test its next support between $39 and $41. If, however support doesn’t hold, the stock’s next likely level of support would probably be between $27 and $28 per share – near lows last seen in late 2016.
Near-term Keys: The stock’s current momentum should definitely point a short-term trader to consider bearish opportunities; however given the stock’s proximity to immediate support, the best signal to consider shorting or using put options on the stock would need to come from a push below $31 per share, with a near-term target around $28 per share. If, however the stock’s current pivot does give the stock some bullish momentum, it could see some room to run from its current level a bit above $32 to $35 per share, which could offer an interesting bullish trade using call options or buying the stock itself. I think the best opportunity to work with BWA right now is on the basis of its valuation, with a long-term perspective to keep in mind even if the stock does push lower in the short term.