I’m wrapping up my run through the Healthcare Equipment industry by looking at a stock that, like just about the entire rest of the industry, is at the extreme high end of a very long-term upward trend. Part of the reason that this industry has drawn my attention this week is because of the extended state not only of the bull market, but also of the U.S. economy in general. In the face of trade concerns, a global economic slowdown, and what I think is an uncertain policy about interest rates, I think it makes sense to think about areas of the market that may be less sensitive to many of those risks.
While the last couple of days have offered hope to investors about trade, the truth is that there is still a long way to go before tariffs between the U.S. and China are likely to be resolved. The Healthcare Equipment industry is interesting against that backdrop because, while these stocks aren’t completely immune to the effect of tariffs, a lot of U.S. healthcare equipment companies have a limited level of exposure to that risk because they generally derive a very minimal amount of their production needs from Chinese imports. It is also true that while some types of medical devices have been included on tariff lists from both sides, the U.S. and China both have reasons to seek lower health care costs and provide better health care, which also helps to insulate the industry from trade and tariff effects.
Edward Lifesciences Corp (EW) is a large-cap stock that as of yesterday’s close was pushing to a new, all-time high closing price, maintaining momentum from an upward trend that has pushed the stock nearly 56% higher over the last twelve months, and that has seen the stock more than double in price over the last two years. Investors that were fortunate enough to get in at the beginning of that run and ride the trend throughout have been fortunate indeed; but such an outsized performance in a relatively short period of time does beg the question of how much opportunity is left.
Another interesting element about EW is the fact that through most of the last recession and concurrent bear market from 2007 to 2009, the stock not only held up very well, it also had short and intermediate stretches of time where it rallied strongly while the rest of the market was going down. I think that is a reflection of the fact that, like many Healthcare Equipment stock, the company’s business demand makes it almost entire immune to most of the cyclical effects of recessionary periods that drag down most stocks. The stock’s incredible performance, combined with that potential insulation to an economic downturn, make EW an interesting stock to pay attention to under current market conditions. The question my review of the industry has led me to in light of that fact is whether there is also a value-based case to make to consider the stock on a long-term basis.
Fundamental and Value Profile
Edwards Lifesciences Corporation is a manufacturer of heart valve systems and repair products used to replace or repair a patient’s diseased or defective heart valve. The Company is engaged in patient-focused innovations for structural heart disease and critical care monitoring. Its segments include United States, Europe, Japan and Rest of World. Its products are categorized into three areas: Transcatheter Heart Valve Therapy, Surgical Heart Valve Therapy and Critical Care. It also develops hemodynamic monitoring systems that are used to measure a patient’s cardiovascular function in the hospital setting. It is developing products, such as the Edwards SAPIEN 3 Ultra System and Edwards SAPIEN XT transcatheter heart valve, among others. Its Transcatheter Heart Valve Therapy and Surgical Heart Valve Therapy products are manufactured in the United States, Singapore and Switzerland. Critical Care products are manufactured in its facilities located in Puerto Rico and the Dominican Republic. EW has a current market cap of $46.8 billion.
Earnings and Sales Growth: Over the last twelve months, earnings grew by a little over 11%, while sales increased more than 15%. In the last quarter, earnings improved by 4.55% while Revenues increased about 9.5%. EW’s Net Income versus Revenue is healthy and strengthening, which is a definite sign of strength. Net Income as a percentage of Revenues increased from 18.28% in the last twelve months to 22.2% in the last quarter.
Free Cash Flow: EW’s Free Cash Flow is modest, but healthy at $728.5 million. That translates to a Free Cash Flow Yield of 1.55%. That doesn’t sound very impressive, but Free Cash Flow has also increased by nearly $200 million since the end of the first quarter of the year, so this is an improving number that lends credence to the quality of the stock’s positive margin profile.
Debt to Equity: EW has a debt/equity ratio of .18, which is very conservative. EW’s balance sheet shows $934.3 million in cash and liquid assets versus $644.5 million in long-term debt. Their operating profile suggests that operating margins are more than adequate to service their debt, with enough cash reserves to liquidate their debt if they chose to do so.
Dividend: EW does not pay a dividend.
Price/Book Ratio: there are a lot of ways to measure how much a stock should be worth; but one of the simplest methods that I like uses the stock’s Book Value, which for EW is $16.83 per share. At the stock’s current price, that translates to a Price/Book Ratio of 13.36, which is high, especially against a historical average of 7.61, which puts the stock’s “fair” value at about $128 per share. That’s -43% away from the stock’s current price, which certainly marks the stock as overvalued; however the stock is also trading about -33% above its historical Price/Cash Flow ratio, which puts its forecasted long-term fair value price at about $149 per share. Adding to the fact that EW is clearly overvalued is the fact that both of these metrics are also well above their industry averages, making EW one of the most expensive stocks in the Healthcare Equipment industry.
Technical Profile
Here’s a look at the stock’s latest technical chart.
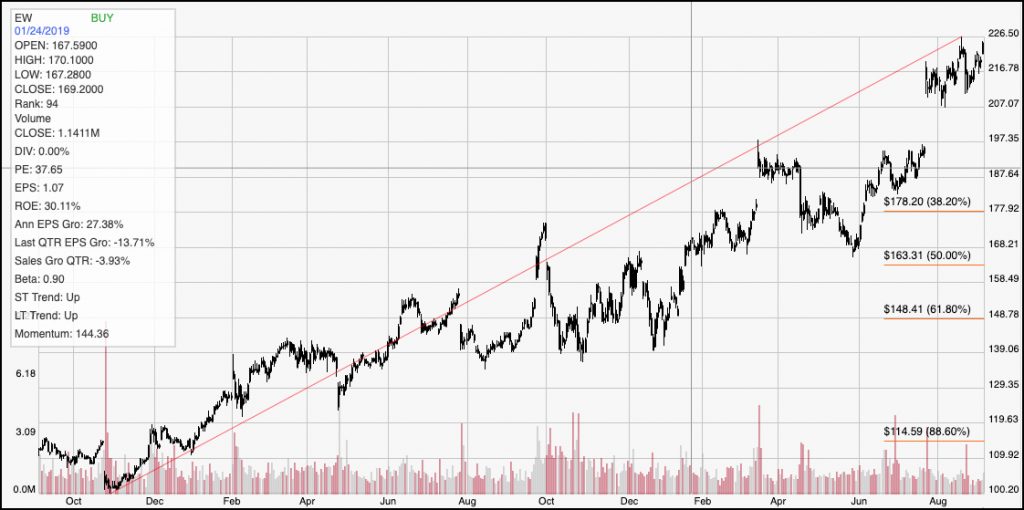
Current Price Action/Trends and Pivots: The red diagonal line traces the stock’s strong upward trend over the last two years. It also provides the base line for the Fibonacci retracement lines shown on the right side of the chart. The stock’s upward trend has accelerated since late July, when EW jumped from about $196 into the $210 price area overnight. Yesterday’s close gave the stock a fresh new all-time high closing price, with the stock apparently set to break resistance at an intraday peak earlier this month at $226.50. Assuming the stock’s current bullish momentum continues, you could use the roughly $16 distance between immediate support at $210 and that peak to forecast a bullish run to about $242; however if the stock drops below that support level, it should certainly see rapid downside to about the $190 to $195 price level, which is where the stock previous consolidation range before that overnight break appears to have been.
Near-term Keys: If you’re a growth-oriented investor, the stock’s strong performance, along with a pretty impressive fundamental profile both make EW look tempting; but unlike other stocks in this industry that I’ve covered this week, there is no valuation metric that leads me to believe there is a case to be made that the stock should be worth more than it is. If you want to take a bullish position in the company, there is certainly a case to be made for a short-term momentum trade using call options or buying the stock itself, with a push above $226.50 offering a short-term target at around $242. If the stock does start to pick up bearish momentum, however, wait to see if the stock breaks support at around $210. That would offer a pretty high-probability signal to consider shorting the stock or working with put options with a bearish target at around $195 per share.