There are a lot of factors that a smart investor should consider when thinking about using a stock for a long-term investing opportunity. A company’s fundamental strength and relative value are two of the primary elements that I pay attention to, but along with those I also factor in technical factors like the stock’s long-term trend and its current momentum. I also think that if you want to give yourself the best chances of success, you also need to consider broad market conditions, including where the economy – global as well as national – and its generally cyclical nature impact the stock you’re thinking about.
This is an opinion that is a little bit at odds with traditional, “pure” value investing principles. The father of value investing, Benjamin Graham, asserted that if a stock could be described as being a strong value, that was the only question that needed to be answered, and you should go ahead and make the investment anyway. In the broadest sense, I agree with that principle, but the problem that I think most investors – myself included – run into in trying to use it successfully is their own emotion.
The truth is that when you invest your hard-earned money, your emotions will always be involved – no matter how much you’ve studied, how long you’ve invested, or how thorough your analysis has been. And while finding a stock at a deep discount generally does mean that in the long-term, the stock should increase in price, the truth is that it doesn’t mean the stock isn’t going to go down more than it may have at the moment. In fact, if the stock has already been dropping, and is at historical lows, that broader trend may keep the stock going down for a while longer. It’s hard for most of us to sit and hold onto a stock while it keeps dropping and keep saying, “It’s a good value. I’ve got to be patient.” That’s why I like to consider technical factors as well as broader market conditions as well.
In the context of the economy, most indications are that the U.S. economy continues to be healthy right now; employment numbers and personal income for the most part continue to show healthy growth, even as trade concerns are beginning to weigh on corporate operations and earnings considerations. A lot of analysts still point to that economic strength as a primary reason to stay bullish about the stock market’s potential for the foreseeable future. There may be some truth to that; but I also see some increasing signs of risk. As the growth of the U.S. economy extends itself beyond the decade mark since the end of the Great Recession – a period of economic health that is previously unheard of, I’ll add – I think that there is an increasing likelihood that it will reverse. The Fed has already cut interest rates once in the last couple of months and appears poised to do it again this month – despite the fact that the economy is growing. That’s one reason I think risk is increasing; another is the ongoing trade war between the U.S. and China. There are signs that increasing tariffs are increasing commodity costs, which means that the negative effect of tariffs are rippling into business operations that don’t include the relationship between those two countries.
Winnebago Industries Inc. (WGO) is a company that at first blush might seem like an interesting way to take advantage of a healthy U.S. economy, and that could act as a shield for your money against tariff risk exposure. Their products are sold almost exclusively in the U.S. and Canada, with no presence in Asia. However, the increase of commodity costs I just mentioned – coming from duties on steel and aluminum, and other tariffs targeting the auto industry specifically – are challenges that even management has acknowledged the company is having to deal with. Those are counters against the idea that when income growth is healthy, consumer are more likely to buy products like recreational vehicles. Let’s take a look at WGO’s numbers and let you decide if this is a stock that you should pay more attention to right now.
Fundamental and Value Profile
Winnebago Industries, Inc. is a manufacturer of a portfolio of recreation vehicles (RV) and marine products used primarily in leisure travel and outdoor recreation activities. The Company produces its motorhome units in manufacturing facilities in Iowa and Oregon; its towable units in Indiana; and its marine units in Florida. Its segments include Motorhome, Towable and Corporate / All Other. Its Motorhome segment is comprised of products that include a motorized chassis, as well as other related manufactured products and services. Its Towable segment is comprised of products which are not motorized and are generally towed by another vehicle, as well as other related manufactured products and services. The Corporate / All Other category includes the Winnebago specialty vehicles and Chris-Craft marine operating segments as well as expenses related to certain corporate administration expenses for the oversight of the enterprise. WGO has a current market cap of $46.8 billion.
Earnings and Sales Growth: Over the last twelve months, earnings grew by almost 12%, while sales declined nearly -6%. In the last quarter, earnings improved by 90% while Revenues increased about 22%. WGO’s Net Income versus Revenue is adequate, and strengthening,, having increased from 5.5% in the last twelve months to 6.9% in the last quarter.
Free Cash Flow: WGO’s Free Cash Flow is modest, at $63.1 million. That translates to a Free Cash Flow Yield of 6.47%. A concern is the fact that this number has declined since the beginning of 2018, when Free Cash Flow was around $110 million.
Debt to Equity: WGO has a debt/equity ratio of .42, which is generally conservative, but doesn’t necessary imply strength in this case. WGO’s balance sheet shows $4.18 million in cash and liquid assets versus $253.07 million in long-term debt. Their operating profile suggests that operating margins are more than adequate to service their debt; however their minimal cash position suggests that liquidity is a concern.
Dividend: WGO pays a dividend of $.44 per share. At the stock’s current price, that translates to an annual yield of about 1.43%. It should be noted their dividend payout is only a little over 10% of their annual earnings per share, which is very conservative.
Price/Book Ratio: there are a lot of ways to measure how much a stock should be worth; but one of the simplest methods that I like uses the stock’s Book Value, which for WGO is $19.07 per share. At the stock’s current price, that translates to a Price/Book Ratio of 1.61, while their historical average is 2.6; that puts the stock’s “fair” value at about $49.50 per share. That’s 61% away from the stock’s current price, which which is very attractive. The stock’s Price/Cash Flow supports the idea that WGO is deeply discounted right now, since it is trading about 39% below its historical Price/Cash Flow ratio, which puts its forecasted long-term fair value price at about $43 per share.
Technical Profile
Here’s a look at the stock’s latest technical chart.
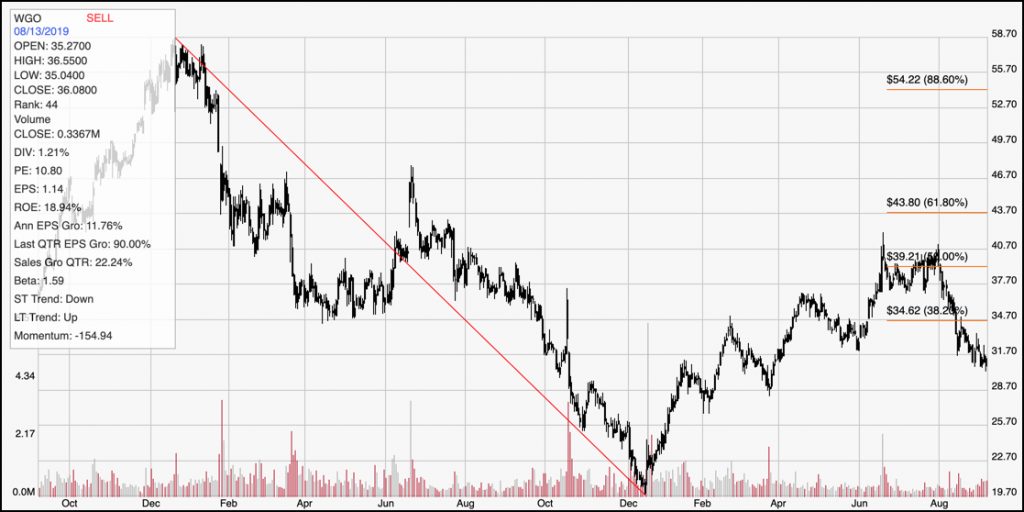
Current Price Action/Trends and Pivots: The chart above shows the last two years of price activity for WGO. The red diagonal line traces the stock’s downward trend throughout 2018. It also provides the base line for the Fibonacci retracement lines shown on the right side of the chart. While the stock is up on a year-to-date basis, it has also dropped sharply over the last month from a high at around $41 to its current price, about -25% below that level. It also appears to have broken below support at around $32 in just the last week or so, which means that level should now act as immediate resistance. The stock’s next likely support level is around $29. Its next support level, wherever it shows, will mark a lower low against the stock’s upward trend since January of this year, which is an indication the stock’s trend could be moving back to the bearish side. A drop below $29 could signal even more weakness, to the $25 or $26 range, or possibly to the stock’s multiyear low around $20. A useful bullish signal would come from a push above the resistance shown by the 38.2% Fibonacci retracement line at around $35; that would mark a continuation of the stock’s upward trend, with near-term resistance from that point next coming around the stock’s high of the year near $40.
Near-term Keys: I think the odds for WGO right now are on the bearish side right now. Signs are that consumer purchases of recreational and luxury vehicles aren’t robust right now, and that seems to be at least part of the reason for the stock’s decline since the beginning of August. If the stock reverses and manages to push above $35, you could think about placing a bullish trade by buying the stock or working with call options, with a near-term target at around $39 to $40. The greater chance is that the stock will keep dropping however, so in the near term a better signal would come from a drop below $29. In that case, consider shorting the stock or working with put options, with an eye on the $25 range as a near-term exit target. While the stock does offer an interesting value right now, I think the stock’s bearish risk right now means that the smarter approach is to wait until there are signs some of the stock’s fundamentals – in particular, Free Cash Flow and cash – are increasing. By the time that happens, the stock’s value proposition is likely to be even stronger than it is now.