An eventful weekend promises to keep the market interesting this week. A series of drone strikes on Saturday knocked out about half of Saudi Arabia’s daily oil production. The culprit has yet to be definitely identified, although the Trump administration didn’t hesistate from pointing fingers at Iran. As of Sunday night, both Brent and West Texas Intermediate crude were sharply higher, with Dow futures pointing to a significantly lower opening on Monday morning.
Increasing geopolitical tensions seem to be just the latest chapter in an ongoing tale of heightened market uncertainty. Saudi Aramco, the national oil company for Saudi Arabia, has announced they will attempt to restore about a third of the country’s daily production by Monday, and President Trump added that the U.S. could pull from its Strategic Petroleum Reserve to keep the market supplied; but that won’t answer additional questions about the parties involved in the attacks or what it might mean in the long-term for the stability of oil demand in the Middle East.
Along with ongoing questions about trade, and the effects tariffs are having not only on the global economy, but also in the U.S., there is an increasing risk that the market could finally be reaching a tipping point. That generally means that some of the top-performing stocks in the market so far this year, including a number of stocks in the Consumer Discretionary sector, could represent a much higher than average level of risk versus its potential near-term reward. That includes stocks in the Hotels, Restaurants and Leisure industry such as Darden Restaurants Inc. (DRI). This is a stock that has performed impressively year-to-date, increasing in value by about 27.5%, and nearly 11% in the last month, including a brand new all-time high in just the last week. Does that mean the run is finally done, or is there more upside left?
Fundamental and Value Profile
Darden Restaurants, Inc. is a full-service restaurant company. The Company owned and operated 1,536 restaurants through its subsidiaries in the United States and Canada, as of May 29, 2016. The Company’s segments include Olive Garden, LongHorn Steakhouse, Fine Dining (which includes The Capital Grille, and Eddie V’s Prime Seafood and Wildfish Seafood Grille (Eddie V’s)) and Other Business (which includes Yard House, Seasons 52, Bahama Breeze, consumer-packaged goods and franchise revenues). As of May 29, 2016, the Company also had 50 restaurants operated by independent third parties pursuant to area development and franchise agreements. Olive Garden’s menu includes a range of authentic Italian foods featuring fresh ingredients and a selection of imported Italian wines. LongHorn Steakhouse restaurants feature a range of menu items, including fresh steaks and chicken, as well as salmon, shrimp, ribs, pork chops, burgers and prime rib. DRI’s current market cap is $15.7 billion.
Earnings and Sales Growth: Over the last twelve months, earnings increased 26.6%, while sales improved by 4.45%. In the last quarter, earnings were slightly negative, by -2.22% while sales were also negative, but mostly flat, at -0.77%. DRI’s margin profile is generally healthy, and showing signs of improvement; in the last quarter, Net Income as a percentage of Revenues was 9.33% versus 8.38% in the last twelve months.
Free Cash Flow: DRI’s free cash flow is strong, at almost $803 million. This is also a number that has increased steadily since the end of 2017, and translates to a free cash flow yield of 5.12%.
Debt to Equity: DRI has a debt/equity ratio of .39. This is a conservative number at first blush that generally suggests the company follows a conservative approach to leverage and debt management. Their balance sheet shows cash and liquid assets of $457 million against long-term debt of $927.7 million. Liquidity has improved over the last nine months, from about $140 million in November of 2018. Their operating profile suggests that DRI should have no problem servicing their debt.
Dividend: DRI pays an annual dividend of $3.52 per share, which translates to a yield of about 2.78% at the stock’s current price.
Price/Book Ratio: there are a lot of ways to measure how much a stock should be worth; but one of the simplest methods that I like uses the stock’s Book Value, which for DRI is $19.44 and translates to a Price/Book ratio of 6.55 at the stock’s current price. Their historical average Price/Book ratio is 4.8, which suggests the stock is overvalued, by a little more than -26%. That puts the stock’s “fair value” at around $93, and its value-based “bargain price” even lower, at around $75 per share.
Technical Profile
Here’s a look at the stock’s latest technical chart.
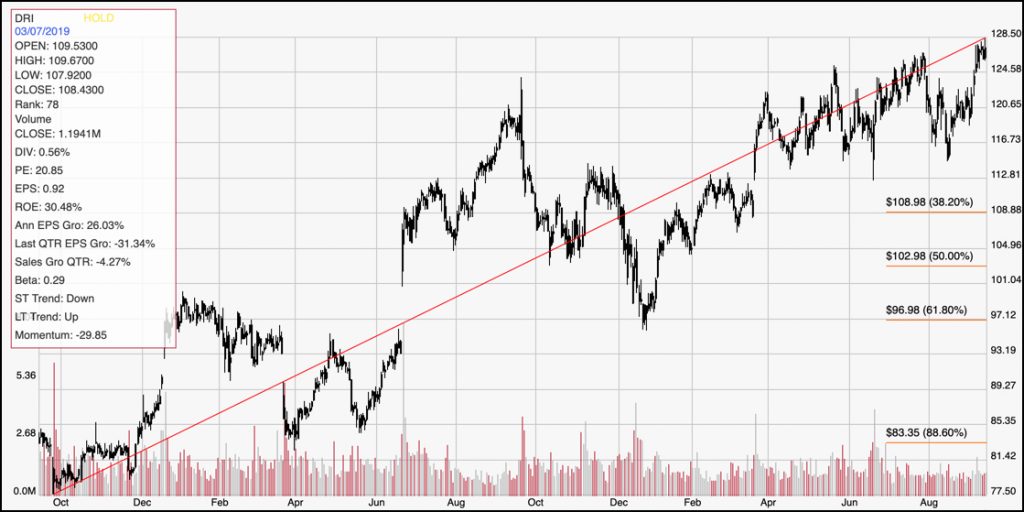
Current Price Action/Trends and Pivots: The diagonal red line traces the stock’s upward trend over the last two years, and provides the reference for calculating the Fibonacci retracement levels indicated by the horizontal red lines on the right side of the chart. The stock has rallied strongly through the first several months of the year, driving near to a new all-time high on Friday. Broader market conditions aside, the stock’s long-term upward trend does indicate that it should be able to keep moving higher. Its last push above near-term resistance was at around $122, which is about $6 below the stock’s current price, and so puts the next likely short-term peak at around $134 per share. Immediate support should be at last week’s push above resistance around $125. From there, the next likely support point is around $120. Given the strength of the long-term trend, the stock would need to drop below the 38.2% Fibonacci retracement line, sitting right around $109 per share.
Near-term Keys: Unless the market can find a fresh, new catalyst to counter current global concerns – in the Middle East, and for trade between the U.S. and China – I think it’s hard to forecast a lot of near-term upside in the stock market right now. If the stock does manage to move higher in the next day or two, an aggressive trader could consider buying the stock or working with call options, with an eye on the $134 level as a short-term exit price. A drop below $125, on the other hand, might work as a bearish signal to think about shorting the stock or to work with put options, with an eye on $120 as an exit point for that trade. From a long-term perspective, it’s hard to argue with the stock’s overvalued state; I think that there is significantly more long-term downside risk that upside potential.