One of the challenges my approach to value investing gives me is how to work with stocks that have been performing strongly under current market conditions. My method tends to favor stocks trading at the lower end of its historical trading ranges, and so seeing a stock already in a long, sustained upward trend usually means that it gets dismissed from further consideration.
Believe it or not, that tendency is at odds with pure value-oriented analysis, which stipulates that current price activity is actually not a valid consideration. To a value investing purist, the only truly important question is whether the stock should be worth more than it is right now. If the business underlying the stock is showing strong fundamental strength that can be quantified at a higher price than the stock’s current value, it should rate as a strong buying opportunity – no matter where the stock may actually be compared to its recent history.
The reason I diverge from the purists is pretty simple. The longer a stock goes up, the more likely its price is to trade at extreme multiples of its normal valuation metrics, which also means that is is much less likely to offer a useful value proposition. I’ve found much greater success in looking for value among fundamentally strong stocks at the lower end of their trading ranges; it’s something of a contrarian notion that I have gotten a lot of mileage out of over the course of more than two decades as an investor.
General Mills, Inc (GIS) is a stock that I identified at the beginning of this year as a good value candidate; at the time the stock was just starting rebound higher from the bottom of a year-long downward trend. From that point, the stock has been a top performer in the market, increasing in value by a little over 41% since the beginning of the year. The stock’s impressive upward trend has tapered off a bit in the last month or so, suggesting that its bullish momentum is waning. The stock has benefitted, to be sure, on investor sentiment that has emphasized stocks in the Consumer Staples sector year to date. This is a company with a solid, improving fundamental profile; but given the stock’s impressive upward performance, it does beg the question of how much opportunity might be left. Is there a value-based argument still to be made, or would a bullish bet on the stock at this late point simply be an aggressive bet on continued growth? You decide.
Fundamental and Value Profile
General Mills, Inc., is a manufacturer and marketer of branded consumer foods and pet food products sold through retail stores. The Company is a supplier of branded and unbranded consumer food products to the North American foodservice and commercial baking industries. It also provides pet food products through its subsidiary Blue Buffalo Pet Products Inc. The Company has four segments: U.S. Retail, International, Pet operating, and Convenience Stores and Foodservice. The Company offers a range of food products with a focus on categories, including ready-to-eat cereal; convenient meals, including meal kits, ethnic meals, pizza, soup, side dish mixes, frozen breakfast and frozen entrees; snacks, including grain, nutrition bars and frozen hot snacks; yogurt, and super-premium ice cream. The Company’s other product categories include baking mixes and ingredients, and refrigerated and frozen dough. It also provides food products for dogs and cats. GIS’s current market cap is $33.2 billion.
Earnings and Sales Growth: Over the last twelve months, earnings increased about 5%, while revenues were almost 7% higher. In the last quarter, earnings and sales both flattened; earnings growth was exactly 0%, while sales declined slightly, by -0.87%. Despite the negative earnings pattern in the most recent quarter, the company operates with a healthy margin profile; over the last twelve months, Net Income was 10.3% of Revenues, and strengthend in the last quarter to 13.7%.
Free Cash Flow: GIS’s free cash flow is about $2.28 billion, which is pretty healthy, and translates to a Free Cash Flow Yield of 6.93%.
Dividend Yield: GIS’s dividend is $1.96 per share, which translates to an annual yield of about 3.59% at the stock’s current price.
Debt to Equity: GIS has a debt/equity ratio of 1.58. This is a high number, and is indicative in part of the debt the company assumed to complete the acquisition of Blue Buffalo Pet Foods in 2018. Their balance sheet shows liquidity was weakened; in the last quarter, cash and liquid assets were about $450 million. This number was about $532.7 million at the beginning of the year. They also currently have $11.6 billion of long-term debt. The company’s margin profile indicates that they should have no problem servicing their debt.
Price/Book Ratio: there are a lot of ways to measure how much a stock should be worth; but one of the simplest methods that I like uses the stock’s Book Value, which for GIS is $12.24 per share. That translates to a Price/Book ratio of 4.49, which is high compared to the Price/Book levels I usually look for. However, the stock’s historical Price/Book ratio is 6.56, which puts a long-term target price around $80 per share and above its 2016 highs. The stock is currently trading at a discount of nearly 46% from that price.
Technical Profile
Here’s a look at the stock’s latest technical chart.
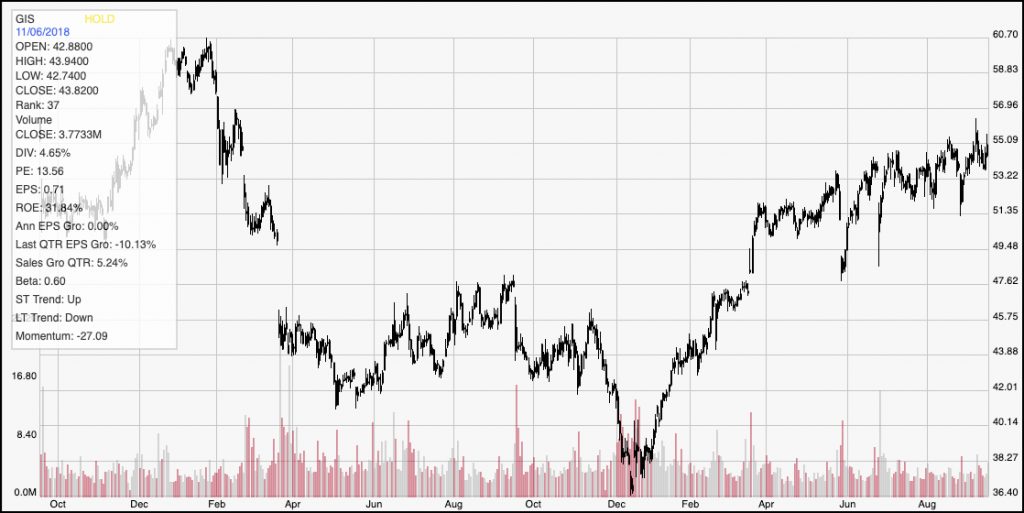
Current Price Action/Trends and Pivots: This chart traces the stock’s movement over the last two years. The stock’s rally from the bottom of the trend has been impressive, and has pushed the stock to about $55 per share. The stock’s trend has clearly begun to flatten, as it has increased from just about $51 in April – five months ago – after rising aggressively from about $36 just four months prior at the beginning of the year. The stock is currently sitting very near to resistance at about $55, with near-term support right around $53, and $51 below that point. A drop below $51 could mark the beginning of a new downward trend, with near-term downside to around $47 per share, while a strong push above $55 could see the stock challenge its two-year high point at nearly $61 per share.
Near-term Keys: If you’re looking for a short-term, bullish trade, look for a break above resistance at $55 as a good signal to buy the stock or to work with call options. If the stock shows weakness, and pushes below support at $51, consider shorting the stock or working with put options. It’s interesting that despite the stock’s increase year to date, it still offers a very interesting value proposition. The stock is due to release its latest earnings report this week, which means the market is likely to find its latest catalyst to either push the stock near to its 52-week highs, or to reverse the current upward trend within the next couple of days.