The market has struggled to define a clear direction in the last couple of days. While the Fed did as most economists and analysts predicted, cutting rates by another quarter point this week, the market was less than enthused by Chairman Powell’s comments, which seemed to fail to deliver the kind of clarity about the central bank’s future plans. A lot of investors hoped, and seemed to have priced in the expectation not only of the actual cut, but also of continued cuts to keep the market’s economic momentum going.
Some investors like to think of the month of September as generally rough sledding for the stock market; investors are coming back from summer vacation, getting their kids started in school, and corporate America begins to transition into a new earnings season, there is quite a bit of historical precedent to the idea that September is a month that can be difficult to navigate. Add to the mix continued uncertainty around trade and escalating concerns in the Middle East as a result of attacks on Saudi Arabia’s largest oil production site, and it isn’t surprising that the market has struggled to find direction this week.
The real question, of course, is whether that uncertainty will translate to broader, longer-term concerns, or whether the market just needs another positive catalyst to keep the longest bull market in history chugging along. Officials from the U.S. and China are expected to meet in the early part of October to resume trade talks, and so it’s probably a good bet that the market will want to price in the hope of progress on that front. Any kind of positive headway could give the stock market another positive push to a new set of all-time highs.
Market enthusiasm, and broad-based economic growth should be a positive for the Consumer Discretionary sector, which has to this point in 2019; as measured by the S&P 500 Consumer Discretionary Sector SPDR (XLY), the sector is up about 23.5% so far this year. That’s been good news for a lot of different industries in the sector, including restaurants and fast food stocks. That includes Wendy’s Company (WEN), the national fast food chain that competes with Burger King (part of Restaurant Brands International, stock symbol QSR) and McDonald’s (MCD). WEN is up about 31.5% year to date; the stock’s trend has accelerated since the beginning of the year, since over the past twelve months the stock is actually by just about 18%. Over the last couple of weeks, the stock dropped sharply from a high at nearly $23 to below $20. Is the dip an opportunity to buy back in and take advantage of the trend, or are there signs the stock could be poised to reverse its trend to the downside?
Fundamental and Value Profile
The Wendy’s Company is the parent company of subsidiary holding company Wendy’s Restaurants, LLC (Wendy’s Restaurants). Wendy’s Restaurants is the parent company of Wendy’s International, LLC (Wendy’s), which is the owner and franchisor of the Wendy’s restaurant system in the United States. Wendy’s is a restaurant company specializing in the hamburger sandwich segment. Wendy’s is engaged in the business of operating, developing and franchising a system of restaurants serving food. The Company operated approximately 6,080 Wendy’s restaurants in operation in North America, as of January 1, 2017. Of these restaurants, 330 were operated by the Company and 5,768 by a total of 376 franchisees, as of January 1, 2017. In addition, as of January 1, 2017, there were 439 franchised Wendy’s restaurants in operation in 29 countries and territories other than North America. Wendy’s is also a partner in a restaurant real estate joint venture with a subsidiary of Restaurant Brands International Inc. WEN’s current market cap is $4.8 billion.
Earnings and Sales Growth: Over the last twelve months, earnings increased about 28.5%, while revenues were almost 6% higher. In the last quarter, earnings increased, also by 28.5%, with sales climbing by 6.5%. Growing earnings is hard to do, and the long-term generally isn’t sustainable, but it is also a positive mark of management’s ability to maximize their business operations. Despite the favorable earnings pattern, WEN operates with a margin profile that, while still generally healthy, is also showing signs of significant deterioration. Over the last twelve months, Net Income as a percentage of Revenues was an impressive 28.8%, but narrowed in the last quarter, to 7.4%. Is it a concern? Maybe. For now, their operating profile looks sufficient to meet immediate needs and service the debt they have.
Free Cash Flow: WEN’s free cash flow is $157.85 million, and translates to a Free Cash Flow Yield of 3.32%. A year ago, Free Cash Flow was almost $237 million, so this is a measurement that coincides – unfavorably – with the deteriorating Net Income I just mentioned.
Dividend Yield: WEN’s dividend is $.40 per share, which translates to an annual yield of about 1.95% at the stock’s current price.
Debt to Equity: WEN has a debt/equity ratio of 5.67. This is an extremely high number, and is primary explanation of the stock’s narrowing operating profile. The balance sheet shows almost $456 million against about $3.2 billion in long-term debt. For the time being, the company should be able to meet short-term needs, and continue to service its debt; however if Net Income and Free Cash Flow both continue to decline, this could become a much larger concern than it is today.
Price/Book Ratio: there are a lot of ways to measure how much a stock should be worth; but one of the simplest methods that I like uses the stock’s Book Value, which for WEN is $2.81 per share. That translates to a Price/Book ratio of 7.31, which is high compared to the Price/Book levels I usually look for. Their historical average Price/Book ratio is 5.55, suggesting that the stock overvalued by about -24% right now. That puts the stock’s “fair value” a little below $15 per share.
Technical Profile
Here’s a look at the stock’s latest technical chart.
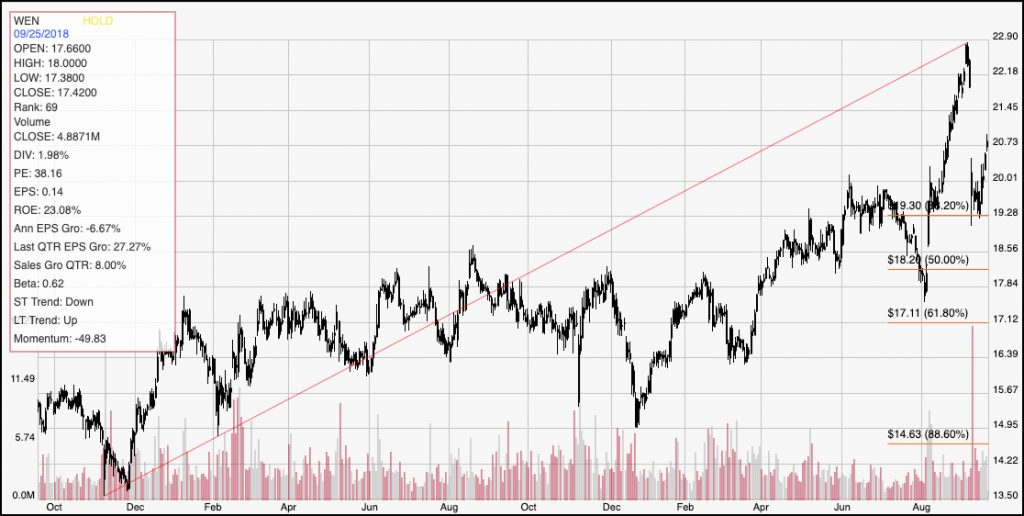
Current Price Action/Trends and Pivots: This chart traces the stock’s movement over the last two years. The red line traces the stock’s upward trend line over that period and also provides the baseline for the Fibonacci retracement lines shown on the right side of the chart. After hitting a multi-year high at nearly $23 per share, WEN dropped back sharply to below $20 per share when an analyst published an opinion that the company’s plans to roll a new breakfast menu on a nationwide basis would not be successful as the company anticipates. The stock has rallied a bit from that point, but is still a couple of dollars below its high, and hasn’t quite filled half of the gap from that drop. Current support for the stock is around $19.50 per share. If the stock’s current bullish momentum fades and the stock drops below that point, its next likely support level is probably around $17.50 based on a pivot low in August. The stock’s current momentum does suggest that there is more short-term upside than bearish risk; however a lot of technicians like to use the midpoint of overnight gaps such as the one that appeared earlier this month to identify near-term resistance for a stock showing bullish strength. That midpoint is right around $21 per share. The stock would need to break above that resistance to provide any additional opportunity to challenge its high at around $23.
Near-term Keys: If you’re looking for a short-term, bullish trade, look for a break above resistance at $21 as a good signal to buy the stock or to work with call options. If the stock shows weakness, and pushes below support at $19, consider shorting the stock or working with put options. Given the fundamental problems WEN shows, particularly in its deteriorating Net Income and Free Cash Flow and high debt load, there really is no way to call this stock a good value, or even to suggest there is a fundamental reason it should be higher than it is today. From that perspective, WEN offers more downside risk than reward potential.