Coming into a new week means that there is an entirely new set of market data to look forward to. The earliest part of the latest earnings season is about to kick off, with a small but important set of earnings reports due from companies like Nike Inc. (NKE), Micron Technology (MU), KB Home (KBH), and Carnival Corp (CCL) to provide an interesting look at the status of the health of a number of sectors of the economy. Will concerns about trade effects over the last quarter reflect in profit results, or will the executives in these sectors provide insight that could add to optimism that the longest period of economic expansion in recorded history can continue?
Market enthusiasm, and broad-based economic growth should be a positive for the Consumer Discretionary sector, which has been one of the top performers to this point in 2019; as measured by the S&P 500 Consumer Discretionary Sector SPDR (XLY), the sector is up about 23.5% so far this year. That’s been good news for a lot of different industries in the sector, including stocks in the Textiles, Apparel & Luxury Goods industry. That is an industry that includes well-known players like Under Armour (UA), NKE, Hanesbrands Inc (HBI) and today’s highlight, Gildan Activewear (GIL). GIL doesn’t have the same cachet that comes from immediate name recognition, but is a very interesting stock because of its focus on private label apparel.
An increasing number of retailers are shifting the products they offer, increasing shelf and floor space to brands offered only in their own stores. GIL’s focus is on partnering with those businesses to manufacture those goods. It’s a trend that is expected to continue to grow, since private labels offer higher margins in the always-competitive retailing industry where margins are consistently thin and becoming even narrower. While the stock is up a little under 17% year to date, the stock has also retraced its current upward trend by about -12% since reaching a peak at around $40.50 in July. With a strong overall fundamental profile, is the drop enough to offer investors a reason to “buy the dip” and hope for a rally back near to, or perhaps beyond those previous highs?
Fundamental and Value Profile
Gildan Activewear Inc. is a manufacturer and marketer of branded basic family apparel, including T-shirts, fleece, sport shirts, underwear, socks, hosiery and shapewear. The Company operates through two segments: Printwear and Branded Apparel. The Printwear segment designs, manufactures, sources, markets, and distributes undecorated activewear products. The Branded Apparel segment designs, manufactures, sources, markets, and distributes branded family apparel, which includes athletic, casual and dress socks, underwear, activewear, sheer hosiery, legwear, and shapewear products, which are sold to retailers in the United States and Canada. The Company sells its products under various brands, including the Gildan, Gold Toe, Anvil, Comfort Colors, American Apparel, Alstyle, Secret, Silks, Kushyfoot, Secret Silky, Therapy Plus, Peds, and MediPeds brands. The Company distributes its products in printwear markets in the United States, Canada, Mexico, Europe, Asia-Pacific and Latin America. GIL’s current market cap is $7.2 billion.
Earnings and Sales Growth: Over the last twelve months, earnings increased a little more than 9.5%, while revenues were almost 5% higher. In the last quarter, earnings increased even more impressively, by 256%, with sales climbing by 28.5%. Growing earnings faster than sales is hard to do, and in the long-term generally isn’t sustainable, but it is also a positive mark of management’s ability to maximize their business operations. GIL operates with a margin profile that is healthy and appears to be strengthening. Over the last twelve months, Net Income as a percentage of Revenues was 10.1%, and increased in the last quarter to 12.4%.
Free Cash Flow: GIL’s free cash flow is $276.16 million, and translates to a Free Cash Flow Yield of 3.86%. At the beginning of 2019, Free Cash Flow was almost $450 million, so this is a decline that could be a concern and bears watching.
Dividend Yield: GIL’s dividend is $.53 per share, which translates to an annual yield of about 1.5% at the stock’s current price.
Debt to Equity: GIL has a debt/equity ratio of .55. This is a conservative number that generally implies management takes a careful approach to leverage. In GIL’s case, however, this is a bit misleading, since their balance sheet for the last quarter shows just $50.5 million in cash and liquid assets against about $958 million in long-term debt. While GIL’s margin profile indicates operating profits are more than adequate to service their debt, the company could face liquidity issues in the event of any shortfall.
Price/Book Ratio: there are a lot of ways to measure how much a stock should be worth; but one of the simplest methods that I like uses the stock’s Book Value, which for GIL is $9.24 per share. That translates to a Price/Book ratio of 3.83, which is high compared to the Price/Book levels I usually look for. Their historical average Price/Book ratio is 3.2, suggesting that the stock overvalued by about -16.5% right now. By contrast, the stock is actually trading about 33% below its historical Price/Cash Flow ratio, which provides a bullish long-term target price at around $47 per share.
Technical Profile
Here’s a look at the stock’s latest technical chart.
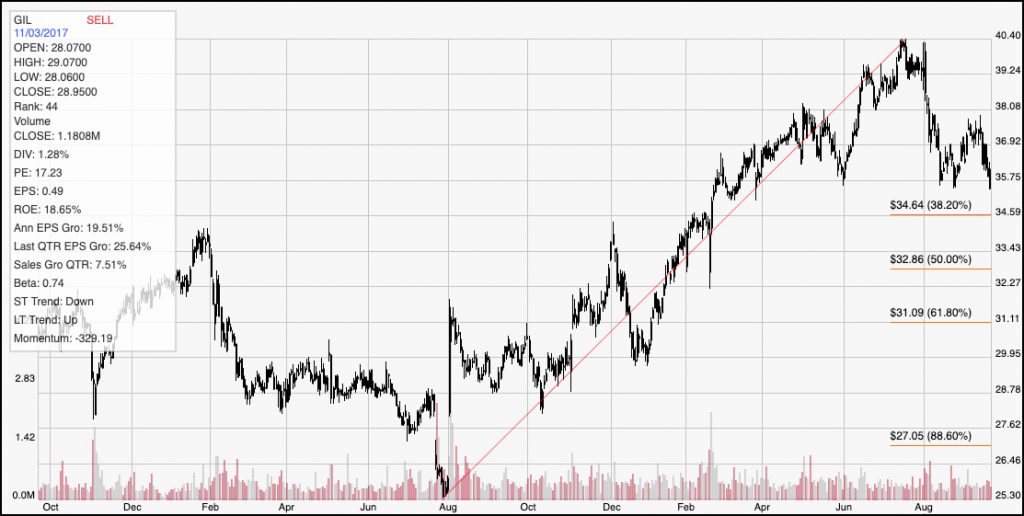
Current Price Action/Trends and Pivots: This chart traces the stock’s movement over the last two years. The red line traces the stock’s upward trend line since August of last year and also provides the baseline for the Fibonacci retracement lines shown on the right side of the chart. GIL’s upward trend hit a high point in July at around $40.50 before dropping back to its current level. It is close to expected support around the 38.2% retracement line, which is sitting right around $34.50, with support from previous pivot lows a little below $36 per share. Its current momentum is bearish, so look for the stock to test the 38.2% retracement line. A pivot off of that line, with a bounce higher could provide new bullish momentum to about $37 per share, with a break above that line acting as a catalyst to see the stock test its two-year high around $40.40. A break below $34.50 would signal a continuation of the stock’s bearish trend, with room to fall to around $31, where the 61.8% retracement line currently sits.
Near-term Keys: If you’re looking for a short-term, bullish trade, look for a support bounce off of $34.50, or a break above resistance at $37 as a good signal to buy the stock or to work with call options. If the stock shows weakness, and pushes below support at $34.50, consider shorting the stock or working with put options. GIL is an interesting stock to pay attention to on a long-term basis. I’m not sure it can be called a good value play as of yet – it would need to drop below its August 2018 low to merit a compelling value argument. If the stock’s fundamental strengths holds, however, with an improvement in Free Cash Flow, and an increase in liquidity as measured by available cash, its long-term opportunity could bear more attention.