If you’re like me, you’re probably a little bit tired of hearing all of the talk about tariffs, China and trade talks. More than simply “the new normal,” trade seems to dominate most of the questions that arise about the health of the global economy and the sustainability of economic growth in the United States.
Part of the challenge about trade risk on an individualized level is that most of what we see about trade and tariffs hasn’t really translated to material changes in consumer prices or habits. For some, that can mean any talk about the damages being inflicted on corporate America by lingering tensions between the U.S. and its largest trading partners – China in particular – sounds like rhetoric at best, or possibly even fake news at worst. To some extent, I think that makes sense, because until pressures ripple through to the consumer level, it’s hard to make the average person see how they aren’t just part of the business world at large.
Given the way trade tensions have centered around technology from the very beginning, I think that one of the first places that consumers are likely to see a tangible effect of tariffs on retail prices is on technology-centered products. That means smart phones, wearables, tablets, computers, and even home appliances. We Americans loves our gadgets, but the longer trade tensions persist, or possibly increase – don’t forget that the U.S. is holding off on increasing tariffs rates that were previously scheduled to go into effect in August – the more likely those increased costs are to simply be passed through from manufacturers all the way through the supply chain to consumer. That’s why I think that Consumer Discretionary stocks like Best Buy Co (BBY) are quite literally on the bleeding edge of tariff exposure and risk. Positive progress, including an eventual resolution, will be beneficial for these stocks, while ongoing uncertainty is likely to simply keep volatility – and therefore investor risk – high.
Besides trade risk, BBY is also navigating a competitive landscape that was already fierce, but that has been under more and more pressure for more than two years from inroads made by Amazon (AMZN) in its digital and technology-centric offerings. That is a symptom of what has become a clear, long-term, “sea change” kind of shift by consumers away from traditional brick and mortar stores to online shopping alternatives. BBY has been working hard to stay relevant amidst that change, and appears to be progressing reasonably well, but the truth is that is going to continue to be a headwind to their business. In the meantime, the stock has followed the broader market’s trend through most of the year, and is about 29% above where it started at the beginning of the year. Since the first of August, however, the stock is down about 12%. Does that drop represent an opportunity to get in at a good value price for long-term investors, or would it smarter to wait? Let’s find out.
Fundamental and Value Profile
Best Buy Co., Inc. is a provider of technology products, services and solutions. The Company offers products and services to the customers visiting its stores, engaging with Geek Squad agents, or using its Websites or mobile applications. It has operations in the United States, Canada and Mexico. The Company operates through two segments: Domestic and International. The Domestic segment consists of the operations in all states, districts and territories of the United States, under various brand names, including Best Buy, bestbuy.com, Best Buy Mobile, Best Buy Direct, Best Buy Express, Geek Squad, Magnolia Home Theater, and Pacific Kitchen and Home. The International segment consists of all operations in Canada and Mexico under the brand names, Best Buy, bestbuy.com.ca, bestbuy.com.mx, Best Buy Express, Best Buy Mobile and Geek Squad. As of December 31, 2016, the Company operated 1,200 large-format and 400 small-format stores throughout its Domestic and International segments. BBY’s market cap is $18 billion.
Earnings and Sales Growth: Over the last twelve months, earnings decreased by about 18.6%, while sales grew about 1.5%. It’s generally difficult for a company to grow earnings faster than sales, and in the long term can’t be expected to continue, but it is also a positive sign of management’s ability to maximize their business operations. BBY operates with a very narrow margin profile, that also appears to be deteriorating. Over the last twelve months, Net Income was about 3.5% of Revenues, while in the last quarter the number dropped to a little less than 2.5%.
Free Cash Flow: Free Cash Flow has declined since the first quarter of 2017 but remains generally healthy at a little more than $1 billion over the past twelve months. That translates to a Free Cash Flow Yield of about 6.01%.
Debt to Equity: the company’s debt to equity ratio is 1.06, which implies that BBY is pretty highly leveraged. Their balance sheet shows about $1.6 billion in cash and liquid assets against roughly $3.4 billion in long-term debt. Their healthy cash position, along with their balance sheet indicates that they should be able to service their debt without a problem; however, if Net Income continues to decline, or turns negative, liquidity could become a problem.
Dividend: BBY pays an annual dividend of $2.00 per share, which translates to an annual yield of about 2.93% at the stock’s current price. It’s worth noting that BBY has increased their dividend from $1.80 a year ago, and authorized a new, $5 billion share repurchase program in the first quarter of 2019. Both moves are signs not only of management’s desire to return value to shareholders, but also an expression of management’s confidence in the company’s long-term prospects.
Price/Book Ratio: there are a lot of ways to measure how much a stock should be worth; but one of the simplest methods that I like uses the stock’s Book Value, which for BBY is $12.46 per share. At the stock’s current price, that translates to a Price/Book Ratio of 5.47. Their historical average is only 3.58, which means the stock is trading about -35% above its historical average. At par with that historical average, the stock’s price would be only $44, which I think underscores the kind of risk investors who want to jump in now could be exposed to.
Technical Profile
Here’s a look at the stock’s latest technical chart.
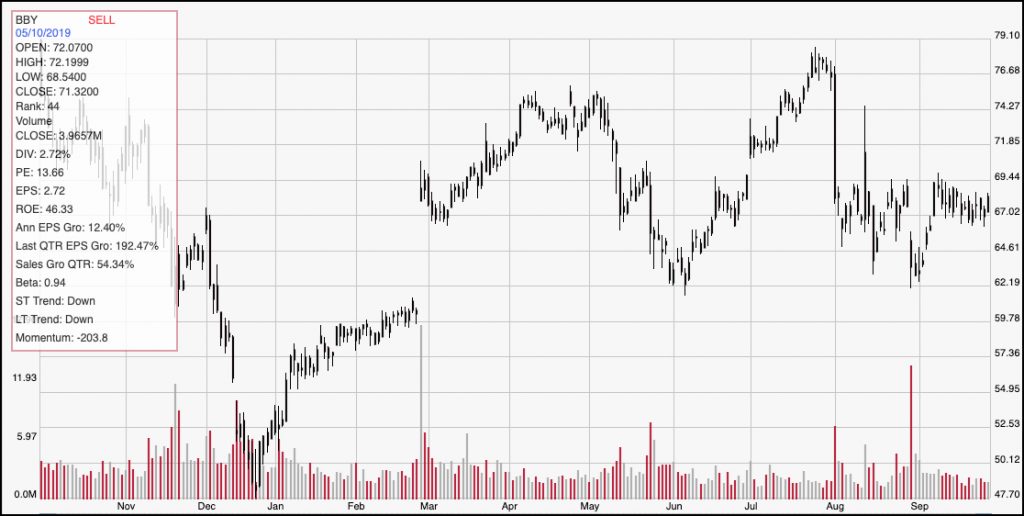
Current Price Action: This chart represents BBY’s price activity over the past year. The stock’s rise from January of 2019 to the end of July is impressive; however the stock dropped more than 12% in a single session at the beginning of August, and since that point has mostly hovered around its current price level ever since. Its trading range, in fact has narrowed since the beginning of September, with support sitting right at $67 and resistance at around $69.50. A break above $69.50 could give the stock room to run to about $74, based on a previous pivot points in July, May and April. A push below $67 could see the stock drop to somewhere between $62 and $64.50 in fairly short order, testing support level seen in August.
Near-term Keys: If you’re looking for a value-based, long-term investment, there is no way you should be considering BBY. In fact, the stock would need to drop to somewhere around $35 before it can really be considered any kind of realistic bargain, based on current fundamentals and valuation metrics. If you’re looking for a short-term opportunity, however, there are a couple of signal points that could be useful. A push above $69.50 could act as a good signal to consider buying the stock or working with call options, with a short-term, momentum-based target price at around $74 per share. If the stock drops below current support at $67, you could also think about shorting the stock or buying put options, with an eye on $64.50 as a quick profit-taking point, with $62 another interesting potential target point beyond that.