I find it pretty interesting that despite all the hand-wringing about trade, many of the companies in industries that are most directly affected by tariff uncertainty, including semiconductors, have performed incredibly well this year. Technology companies are among those that everybody recognizes are the most directly impacted by trade, and since tariffs between the U.S. and China haven’t gone away, or really even been reduced in any tangible way over the past year or so, it would be easy to assume that making money in tech stocks has been tough sledding.
Despite that perception, a number of industries in the Technology sector have performed incredibly well year-to-date. As measured by the Philadelphia Exchange Semiconductor iShares ETF (SOXX), for example, the semiconductor industry boasts an impressive return year-to-date of more than 33%. That translates well to some of the most interesting stocks in the industry, including those that have a major portion of their business coming from customers or partnerships in China.
Applied Materials Inc. (AMAT) is a very good example. The company is a supplier of manufacturing equipment, services and solutions for the entire semiconductor industry, with a big chunk of their operations coming out of China. That means that they are directly in the crosshairs of tariff worries, and in fact have cited the trade war in recent earnings reports as being among the headwinds they’ve been forced to deal with. That hasn’t stopped the stock from increasing nearly 53% year to date, or even from jumping nearly 10% since the latter of September.
As we move into October, with trade discussions between the U.S. and China set to continue in Washington, the market seems to be looking for reasons, perhaps more than ever, to price in the hope of a thaw, or possibly even progress on the tariff front. My concern is that, while it is a possible a deal could be reached, it will probably not come until sometime in 2020 (if at all), which means that tariffs will continue to drag not only on semiconductor stocks, but also also to weigh more and more heavily on the entire economy. There are already signs that affect is increasing, and that means that stocks like AMAT, despite boasting impressive fundamentals, could simply be a way to take on even more risk than I think conditions may justify.
Fundamental and Value Profile
Applied Materials, Inc. provides manufacturing equipment, services and software to the global semiconductor, display and related industries. The Company’s segments are Semiconductor Systems, which includes semiconductor capital equipment for etch, rapid thermal processing, deposition, chemical mechanical planarization, metrology and inspection, wafer packaging, and ion implantation; Applied Global Services, which provides integrated solutions to optimize equipment and fab performance and productivity; Display and Adjacent Markets, which includes products for manufacturing liquid crystal displays, organic light-emitting diodes, upgrades and roll-to-roll Web coating systems and other display technologies for televisions, personal computers, smart phones and other consumer-oriented devices, and Corporate and Other segment, which includes revenues from products, as well as costs of products sold for fabricating solar photovoltaic cells and modules, and certain operating expenses. AMAT has a current market cap of $46.2 billion.
Earnings and Sales Growth: Over the last twelve months, earnings dropped by -23.5%, while sales declined by almost -11%. Despite these declines, the company’s margin profile remains impressive; Net Income versus Revenue was more than 20% in the last quarter, which is very strong – but it should be noted that over the last twelve months that number is a little over 23%. The comparative decline, I believe is a reflection of the effect of tariffs up to this point, which also suggests that continued, increased tariffs could see these numbers drop even more.
Free Cash Flow: AMAT’s Free Cash Flow is strong, at more than $2.9 billion. While this number declined from about $7 billion at the beginning of 2018, it is also up from its level around $2.5 billion at the end of 2018.
Debt to Equity: AMAT has a debt/equity ratio of .65, which is conservative, and implies debt management shouldn’t be a problem. The company has about $3.5 billion in cash and liquid assets, which means they they have plenty of liquidity, against $5.3 billion in total long-term debt.
Dividend: AMAT pays an annual dividend of $.84 per share, which at its current price translates to a dividend yield of about 1.68%. It should be noted that the company increased its dividend in the last quarter by 5% annually, from $.80 per share.
Price/Book Ratio: there are a lot of ways to measure how much a stock should be worth; but one of the simplest methods that I like uses the stock’s Book Value, which for AMAT is $8.79 per share. At the stock’s current price, that translates to a Price/Book Ratio of 5.69. The stock’s historical average is 4.35. That is a pretty good indication the stock could be overvalued right now by a little more than -24%. A move to par with its historical average would put the stock a little above $38 per share. By contrast, however, the stock is also trading almost 83% below its historical Price/Cash Flow levels, which translates to a long-term target price in the $91 range. How do you resolve the difference? I think a little, additional historical perspective is useful; at the end of 2018, AMAT’s Book Value was $6.96 per share, and both Price/Book and Price Cash Flow analysis were offering long-term targets between $28 and $60 per share. There is still a wide range between the levels offered by each type; but they are also both trending upward, which suggests the value proposition could lean more to the Price/Cash Flow side. Another way to think about it is in terms of reward: risk. If the Price/Cash Flow forecast is correct, the stock has more than $41 of upside, while if the Price/Book is more accurate, the downside is about $12 right now. That’s a reward: risk ratio of more than 3:1 – something that most traders will tell you is very interesting.
Technical Profile
Here’s a look at the stock’s latest technical chart.
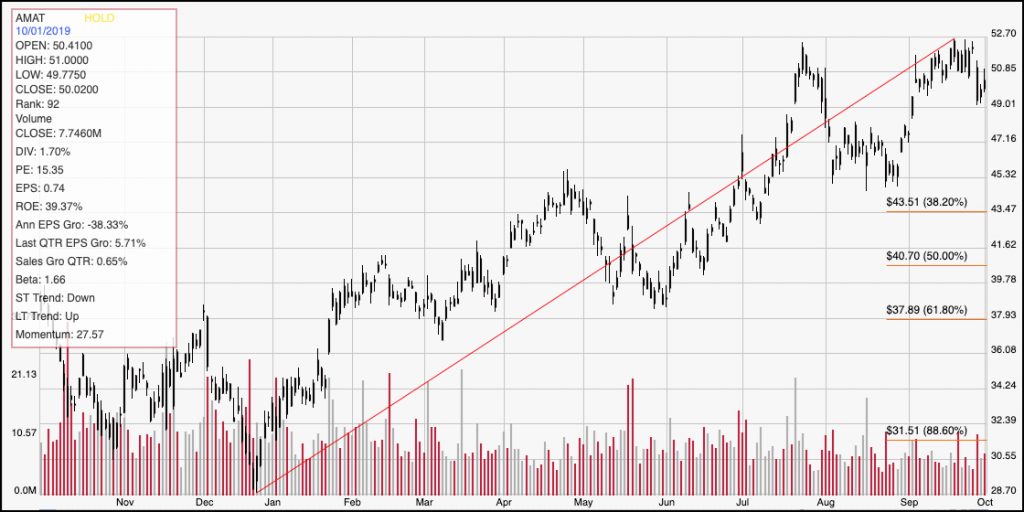
Current Price Action/Trends and Pivots: The chart above covers the last year of price activity. The red line traces the stock’s upward trend from the beginning of the year, and informs the Fibonacci retracement lines on the right side of the chart. The upward trend is easy to see, with the stock recently touching a high point at nearly $53 per share. The stock is just a few dollars below that point now. If the current bearish momentum continues, the stock could drop below immediate support at around $49, which would probably see the stock test its next support somewhere between $45 and $47 per share. A turn back to the upside, with a push above immediate resistance at about $53, could see the stock rally to around $58, which are highs not seen since spring of 2018.
Near-term Keys: If you like working the short side of the market, the strength of the upward trend might make a bullish trade look tempting right now; but the smart move is to wait and see if the stock will break the $53 resistance level I just mentioned. That could offer a pretty interesting bullish trade with a profit target around $58. Current short-term momentum is working in the favor of a bearish trade; if the stock can break below $49, there could be an interesting signal to short the stock or work with put options with a short-term target price at around $45. What about the value proposition? I think lot of that depends on your perspective about the prospect for the stock in the long-term, as well as your ability to tolerate near-term risk, not only in the stock but most particularly right now to trade concerns. The market is overly inclined to look for the smallest reasons to push stocks higher, which makes the contrarian in me believe that downside risk could be more elevated right now than it has been in a year. If that is true, the stock’s Price/Book ratio “fair value” target around $38 could be more realistic than most investor would like to admit.