One technician says the S&P 500’s chart looks like the index is setting up for a breakout.
October has already been a wild month.
So far for the month, the S&P 500 is down -2%. And just this week, stocks were down on Tuesday on fading hopes that the U.S. and China could come to an agreement at this week’s trade negotiations, then was back up to break a three-day losing streak today on reports that China might be willing to discuss a partial trade deal.
While the seesaw that is the trade war has certainly put pressure on stocks, there’s also been a slew of weak economic data released so far this month that sparked a sell-off in the market last week.
Last Tuesday, the ISM said that U.S. manufacturing activity contracted to its worst level since June 2009 last month, marking the second straight month of contraction. Then last Wednesday, ADP and Moody’s Analytics released a report that showed that the labor market is getting tighter. And then last Thursday, the ISM reported that, while the services sector continued to grow last month, that growth has slowed down considerably.
But as many in the market have been wringing their hands over fears of an incoming recession as the parade of negative economic data marches on, Goldman Sachs said this week that the U.S. still isn’t close to a downturn.
“This downturn in manufacturing has been one of the longest on record and may start to stabilize, if not improve, somewhat soon,” Goldman chief global equity strategist Peter Oppenheimer wrote in a note. “Our economists remain of the view that growth has slowed but is not close to recession. … Assuming no recession, it is too early to expect this equity bull market to end in our view.”
And Bank of America Merrill Lynch chief equity technical strategist Stephen Suttmeier says that, while stocks have had a difficult couple of months, the S&P 500 could still see higher highs in the remainder of this year.
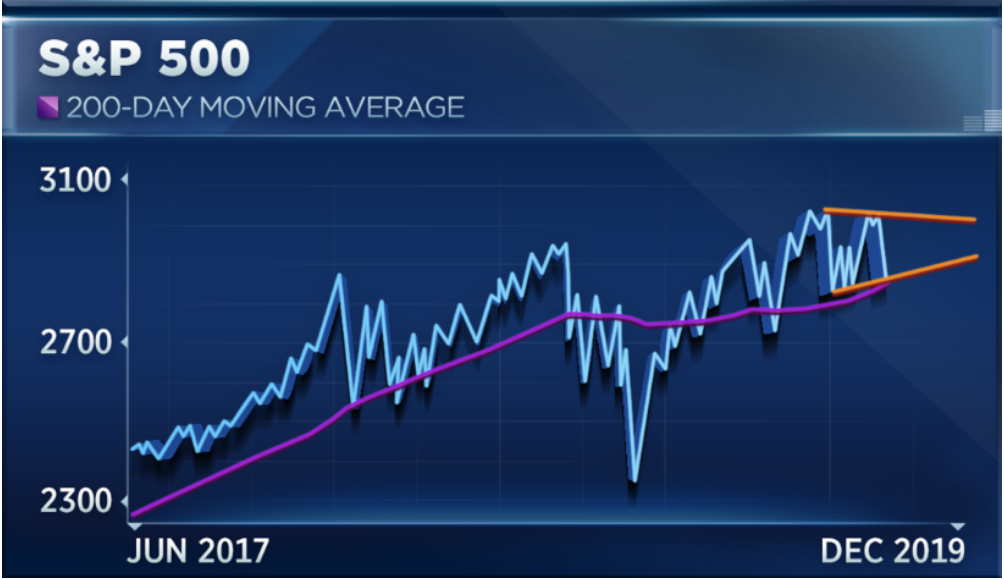
“I actually think we’re building some kind of a base,” Suttmeier said, pointing to a chart of the index.
“Generally speaking, market breadth indicators have been fairly constructive, and we’re still in this weaker seasonal period. So… the weaker seasonality has given us the trick,” Suttmeier said. “But seasonality gets a lot better in November on a three-month and six-month basis going back to 1928.”
Suttmeier cited a triangle pattern forming just above the 200-day moving average for the index, indicating a narrowing trading range that technicians generally find to be an indicator of a possible breakout higher.
“So, you buy the lower end of the range, meaning you buy 2,850, and, for now, you sell the upper end of it around 3,000,” Suttmeier said. “But I do think eventually this should resolve higher given that the breadth has been positive [and] investor sentiment generally pretty bearish out there.”
In other words, unless there’s a significant rise in negative macroeconomic data, the trading pattern of the S&P 500 indicates the index should strengthen heading into 2020.
Suttmeier has a year-end target of 3,100 for the index.
“We think this resolves to the upside, meaning going to new highs, and if that happens, we think we could hit that 3,100 area,” said Suttmeier. “That triangle pattern itself would suggest there’s actually upside towards that 3,200 area if that bullish seasonality kicks in on the S&P.”
Goldman Sachs also sees the S&P 500 at 3,100 by year-end, indicating 6% upside from Wednesday’s close.