Cisco Systems Inc. (CSCO) is one of the most recognizable and established companies in the Technology sector. With a market cap of nearly $200 billion, they are also one of the largest, if not THE largest player in the Networking & Communications segment. They are, without question, the standard that all other networking businesses are measured and compete against. No matter whether you’re talking about wired or wireless networking, CSCO is one of the companies that not only developed the standards and infrastructure the entire Internet is built on today, but that continues to lead the way into the future, including cloud-based computing and the next generation of technology in the so-called “Internet of Things” (IoT).
It’s ironic, perhaps that despite CSCO’s unquestioned dominance in its industry, the stock has mostly languished for nearly two decades. After riding the “dot-com boom” of the late 1990’s to a peak at around $80 per share, the stock cratered when that boom went bust, dropping to as low as about $8 in late 2002. From that point it never rose higher than into the low $30 range – at least not until the latter part of 2017, when the stock finally broke that top-end resistance. That pushed the stock to a high in May a little above $46 per share as Tech stocks generally prospered. 2019 started off pretty well for investors in the stock, as well; the stock increased about 30% from its late December 2018 low around $40 per share, and hit a new multi-year high a little above $58 in mid-July.
From that high, however, the stock took the brunt of new tensions on the trade front that have pressured the entire tech sector for most of the year. From that July high, the stock has dropped a little over -20% to its current price a little above $46. The question at this point for a stock like CSCO – one of the unquestioned “600-pound gorillas” of tech stocks – is whether that drop invites a new opportunity to “buy the dip.”
While I recognize CSCO’s dominance in its industry, expect it to continue, and can readily attest to the company’s core fundamental strength, my reliance on value analysis also forces me to look at the stock’s current price in more conservative terms. Even with the drop to the stock’s current price, CSCO continues to look very overvalued. The stock crated after its last earnings report came in lower than analysts expected, with much of the decline attributed to trade-related headwinds. And while progress on the trade front is encouraging, I also believe that tangible indications of fundamental improvements for the entire Tech sector aren’t going to be seen for some time – provided that a tangible, and real trade deal between the U.S. and China is actually reached. Until then, most analysts are predicting that businesses will likely wait to make any significant investments in new networking or cloud-based solutions, opting instead to make do with what they already have. That means that for the time being, I believe the long-term prospects for CSCO’s stock are probably limited. Let’s dive in to the number so you can decide for yourself.
Fundamental and Value Profile
Cisco Systems, Inc. (CSCO) designs and sells a range of products, provides services and delivers integrated solutions to develop and connect networks around the world. The Company operates through three geographic segments: Americas; Europe, the Middle East and Africa (EMEA), and Asia Pacific, Japan and China (APJC). The Company groups its products and technologies into various categories, such as Switching; Next-Generation Network (NGN) Routing; Collaboration; Data Center; Wireless; Service Provider Video; Security, and Other Products. In addition to its product offerings, the Company provides a range of service offerings, including technical support services and advanced services. The Company delivers its technology and services to its customers as solutions for their priorities, including cloud, video, mobility, security, collaboration and analytics. The Company serves customers, including businesses of all sizes, public institutions, governments and service providers. CSCO has a market cap of $196.8 billion.
Earnings and Sales Growth: Over the last twelve months, earnings grew by almost 17%, while sales growth was more modest, at about 4.55%. Growing earnings faster than sales is hard to do, and generally not sustainable in the long-term; however it is also a positive mark of management’s ability to maximize their business operations. In the most recent quarter, earnings grew about 7% while sales growth was 3.63%. CSCO has a very healthy operating profile, with Net Income running at 22.3% of Revenues over the last twelve months. That number declined in the last quarter to 16.4%, but even so remains healthy.
Free Cash Flow: CSCO’s free cash flow over the last twelve months is $14.9 billion. This is a number that the company has historically managed to maintain at very healthy levels and translates to a Free Cash Flow Yield of 7.64%.
Debt to Equity: CSCO has a conservative, manageable debt-to-equity ratio of .43. CSCO’s balance sheet shows more than $33.4 billion in cash and liquid assets versus about $14.4 billion in long-term debt. Servicing their debt is not a concern, and liquidity to pursue additional expansion or return value to shareholders via stock buyback or increased dividends is excellent.
Dividend: CSCO currently pays an annual dividend of $1.40 per share, which translates to an annual yield of about 3.04% at the stock’s current price.
Price/Book Ratio: there are a lot of ways to measure how much a stock should be worth; but one of the simplest methods that I like uses the stock’s Book Value, which for CSCO is $7.91 per share; this is where the biggest cracks in the bargain argument really exist. At the stock’s current price, its Price/Book ratio, at 5.86, is more than twice as high as its historical average of 2.9; a drop to par with that average puts the stock at risk of a decline of more than -50% to around $23 per share from its current price. That would also put the stock at price levels it hasn’t seen since early 2016. Working with the stock’s Price/Cash Flow ratio is somewhat more favorable, but still overvalued, since the stock is -7% above its historical average, providing a “fair value” target at around $43 per share.
Technical Profile
Here’s a look at the stock’s latest technical chart.
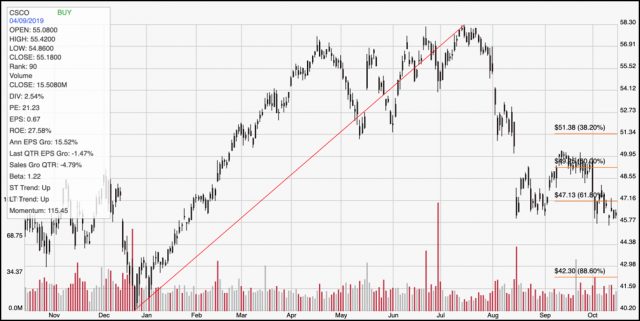
Current Price Action/Trends and Pivots: The diagonal red line traces the stock’s upward trend from late December 2018 to mid-July and provides the reference for calculating the Fibonacci retracement levels indicated by the horizontal red lines on the right side of the chart. The stock’s decline from that point followed a rapid, steep slope, with an overnight gap in mid-August that pushed the stock to a low point around $46 per share. The stock temporarily rallied to a short-term high at around $50 before dropping back to near that level below the 61.8% retracement line. The stock is currently sitting practically on top of support from the August low, but a drop below $46 could see the stock drop as far as the 88.6% retracement line, which is around $42 per share. If the stock can break above immediate resistance at $47 as shown by the 61.8% retracement line, the stock could rally to about $51 where the 382.% retracement line rests.
Near-term Keys: “Buying the dip” right now looks tempting, but it is also a pretty aggressive move; it’s hard to say that’s a smart bet under current market conditions, even with recent optimism on the trade front. If you prefer to work with short-term trading strategies, the stock could offer an interesting momentum-based opportunity, if the stock can hold support at around $46 and even start moving higher. If it can break immediate resistance, you could use it as a signal to buy the stock or work with call options with an eye on $51 as a target price. A drop below $46 would be a strong signal to consider shorting the stock or buying put options, with $42 offering a useful target for a bearish trade.