Over the last couple of months, as market sentiment has focused heavily on geopolitical news like the U.S.-China trade war, Brexit, and Iran-driven tension in the Middle East, I’ve noticed an increasing number of analysts start talking about a shift in market momentum away from growth-oriented stocks and focusing on more defensively-positioned strategies. That conversation has included discussion about two strategies that I like to combine into my own personal investing method: dividend-paying stocks and value analysis.
Neither dividend, nor value investing are automatically defensive in nature as investing strategies; however they do tend to emphasize more conservative measurements and evaluations, including long-term projections than purely growth-driven strategies do. Dividend stocks, for example off the advantage of a passive income source that can compete reasonably well against the most conservative bond yields, which gives investors a buffer zone to work with in the event that bear market conditions prevail. Value analysis tends to favor stocks that are already trading a deeply discounted levels, which implies that, like dividend stocks, they should generally carry less downside exposure than growth-oriented stocks.
I like to combine both dividends and value analysis in my system whenever I can. The more uncertain the market becomes, it’s also interesting to see how stocks offering the highest dividends start to generate more and more conversation. That’s where today’s stock enters the picture. Royal Dutch Shell plc (RDS.A) is one of the largest integrated oil & gas companies in the entire world – one of the seven oil “supermajors” with operations that span the globe and touch multiple industries within the Energy sector. It’s also a dividend king, with a current dividend yield that is far above that offered by the longest-term Treasury bonds. Even more interesting is the fact that volatility in crude oil prices has has kept the pressure on the stock’s price; it is currently only about 2% above a multi-year low, but could be building some good bullish momentum, with plenty of upside opportunity. Does that mean that this could be a good time to make a conservative bet that the stock is also a terrific value? Let’s dig in to find out.
Fundamental and Value Profile
The Royal Dutch Shell plc explores for crude oil and natural gas around the world, both in conventional fields and from sources, such as tight rock, shale and coal formations. Based in the Netherlands, the Company’s segments include Integrated Gas, Upstream, Downstream and Corporate. The Integrated Gas segment is engaged in the liquefaction and transportation of gas and the conversion of natural gas to liquids to provide fuels and other products, as well as projects with an integrated activity, ranging from producing to commercializing gas. The Upstream segment includes the operations of Upstream, which is engaged in the exploration for and extraction of crude oil, natural gas and natural gas liquids, and the marketing and transportation of oil and gas, and Oil Sands, which is engaged in the extraction of bitumen from mined oil sands and conversion into synthetic crude oil. The Downstream segment is engaged in oil products and chemicals manufacturing, and marketing activities. RDS.A’s current market cap is $234.7 billion.
Earnings and Sales Growth: Over the last twelve months, earnings declined a little over -23%, while revenues dropped by almost -7.5%. In the last quarter, earnings declined nearly -34% while revenues grew by 7.2%. The company’s margin profile is very narrow, and appears to be deteriorating; in the last twelve months, Net Income was 5.32% of Revenues, but dropped to 3.26% in the last quarter.
Free Cash Flow: RDS.A’s free cash flow is extremely healthy at $33.6 billion. That translates to a Free Cash Flow Yield of 14.2%.
Debt to Equity: RDS.A has a debt/equity ratio of .39. This is a conservative number that reflects a disciplined approach to debt management. RDS.A is an interesting company in the Energy industry, since growth in revenues and earnings can be volatile depending on the direction of crude prices. RDS.A’s conservative approach, however, emphasizes a “lower forever” mindset about capital expenditures and cost management that assumes an average price of around $30 per barrel of Brent crude. That mindset is reflected in the fact that in the last quarter, the company reported around $25.5 billion in cash and liquid assets against about $76 billion in long-term debt. While their operating margins have narrowed, that appears to be the effect of some one-time charge-offs that took place in their most recent quarter but that have been attributed as temporary setbacks which management expects to be offset in the second half of 2019 and into 2020.
Dividend: RDS.A pays an annual dividend of $3.76 per share, which translates to an annual yield that of about 6.45%. That is one of the highest dividend yields in the entire market, and yet there is no indication the company is likely to need to reduce its payout even if bear market, or even recessionary economic conditions prevail.
Price/Book Ratio: there are a lot of ways to measure how much a stock should be worth; but one of the simplest methods that I like uses the stock’s Book Value, which for RDS.A is $48.59, and which translates to a Price/Book ratio of 1.21 at the stock’s current price. Their historical average Price/Book ratio is 1.18, which means the stock is slightly overvalued by about -2.3%; however the stock is also trading a little over 25% below its historical Price/Cash Flow ratio, which puts a long-term target price at around $57.50 per share.
Technical Profile
Here’s a look at the stock’s latest technical chart.
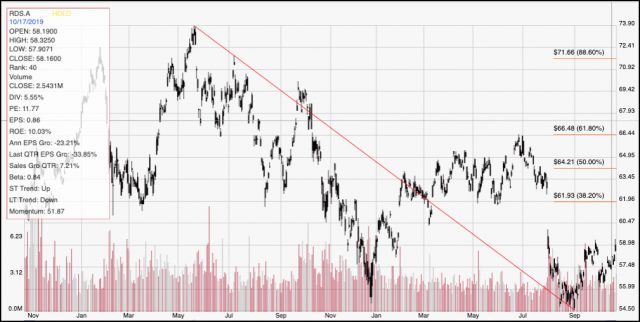
Current Price Action/Trends and Pivots: The diagonal red line on the chart above traces the stock’s downward trend from May of 2018 to its low point at the beginning of September. It also provides the baseline for the Fibonacci retracement lines shown on the right side of the chart. From its low point at around $54.50, the stock has staged a useful short-term upward trend, with the stock now sitting just a little below $59 as of this writing. It is also very near immediate resistance at about $59, with near-term support around $56; both levels are based on recent pivot points around those prices. A break above $59 should give the stock short-term momentum to push to about $62 per share, while a drop below $56 should see the stock retest its 2-year low price around $54.50.
Near-term Keys: The stock’s recent upward trend makes looking for a short-term bullish trade an interesting prospect, provided the stock can push above $59 and maintain its price above that point. That could be a useful signal to buy the stock or work with call options with a near-term price target at around $62, which is also where the 38.2% Fibonacci retracement line sits. If the stock’s current momentum reverses to the downside, however, there could be an interesting opportunity to short the stock or to buy put options if the stock drops below $56. In that case, use the stock’s low at around $54.50 as a very near-term target price. From a longer-term perspective, RDS.A carries some interesting elements that could make it a very good bet in an uncertain market, even with potential continued volatility in crude prices. Its high dividend is compelling, and the fact the company is based outside the U.S., with operations across the globe means that it could offer an interesting way to diversify your portfolio on a global scale. The value proposition is interesting, if not quite compelling, given the stock’s deteriorating Net Income; however if that condition is temporary, as management and most analysts seem to expect, the next earnings report could easily shift that perspective very quickly.