Yesterday I highlighted Royal Dutch Shell plc (RDS.A), because despite the company’s elevated status in the Energy sector as an oil supermajor (one of only seven companies across the globe that fit that description), the stock is sitting near multi-year lows. Much of the pressure on the oil industry over the last few months can be tied not only to a ripping effect of trade tensions, but also geopolitical pressures in the Middle East as well as ongoing supply constraints in one of the biggest areas for U.S. oil exploration and production, the Permian Basin.
Those pressures have effected a number of stocks in the industry, including supermajors like RDS.A and the stock I’m highlighting today. Exxon Mobil (XOM) is another supermajor, the world’s largest publicly-owned integrated oil company, and like RDS.A has been in business for more than 100 years. Also like RDS.A, XOM is moving higher after nearing a multi-year low from the end of 2018, and that has extended a downward trend in the stock that dates all the way back to 2014.
Extended downward trends that cover years at a time are pretty unusual, especially when the broad market is extending a bullish trend beyond any previous historical precedent. Efficient market theory suggests that such a long downward trend is most likely driven by fundamental weaknesses that keep investors away from the stock; but at some point, even a skeptic has to start evaluating the numbers and start considering the stock’s potential as a useful value-based opportunity. XOM has a big capital investment in the Permian Basin, where supply pipeline limitations have kept shale oil from that area from getting to market in a timely fashion. Some of those constraints are expected to lessen moving into the end of year and into 2020, and that means that one of the biggest expected headwinds for the past year or so for XOM could be about to turn a corner. Should you take the stock seriously? Let’s find out.
Fundamental and Value Profile
Exxon Mobil Corporation is engaged in energy business. The Company is engaged in the exploration, production, transportation and sale of crude oil and natural gas, and the manufacture, transportation and sale of petroleum products. The Company also manufactures and markets commodity petrochemicals, including olefins, aromatics, polyethylene and polypropylene plastics, and a range of specialty products. The Company’s segments include Upstream, Downstream, Chemical, and Corporate and Financing. The Upstream segment operates to explore for and produce crude oil and natural gas. The Downstream operates to manufacture and sell petroleum products. The Chemical segment operates to manufacture and sell petrochemicals. The Company has exploration and development activities in projects located in the United States, Canada/South America, Europe, Africa, Asia and Australia/Oceania. XOM’s current market cap is $295.1 billion.
Earnings and Sales Growth: Over the last twelve months, earnings declined -20.6%, while revenues dropped by -6%. In the last quarter, earnings increased nearly 33% while revenues grew by almost 8.6%. The company’s margin profile is very narrow, and appears to be deteriorating; in the last twelve months, Net Income was 6.3% of Revenues, but dropped to 4.53% in the last quarter.
Free Cash Flow: XOM’s free cash flow is generally healthy at $11.3 billion. That translates to a modest Free Cash Flow Yield of 3.87%.
Debt to Equity: XOM has a debt/equity ratio of .10. This is a conservative number that reflects a disciplined approach to debt management. XOM is an interesting company in the Energy industry, since growth in revenues and earnings can be volatile depending on the direction of crude prices. Their conservative approach is reflected in the fact that in the last quarter, the company reported around $4.2 billion in cash and liquid assets against about $19 billion in long-term debt. While their balance sheet indicates that liquidity is less than ideal, it also indicates that they should have no problem servicing their debt from operating profits.
Dividend: XOM pays an annual dividend of $3.48 per share, which translates to an annual yield that of about 5.04%. That is one of the highest dividend yields in the entire market that puts their yield far above even long-term bonds, and like RDS.A makes them a “dividend king.”
Price/Book Ratio: there are a lot of ways to measure how much a stock should be worth; but one of the simplest methods that I like uses the stock’s Book Value, which for XOM is $46.91, and which translates to a Price/Book ratio of 1.48 at the stock’s current price. Their historical average Price/Book ratio is 1.94, which means the stock is undervalued by about 30.6%; XOM is also trading a little over 58% below its historical Price/Cash Flow ratio, which puts a long-term target price between $91 and $110 per share.
Technical Profile
Here’s a look at the stock’s latest technical chart.
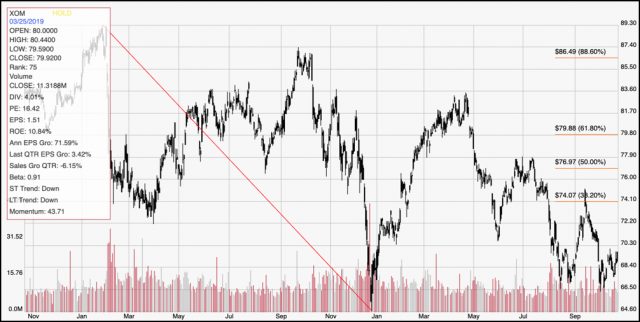
Current Price Action/Trends and Pivots: The diagonal red line on the chart above traces the stock’s downward trend from January of 2018 to its low point at the end of December. It also provides the baseline for the Fibonacci retracement lines shown on the right side of the chart. The stock rallied strongly in the first few months of the year, touching a high near $84 before dropping back again to follow its longer-term downward trend. More recently the stock has rebounded from a major pivot low support point at about $66.50 per share, with immediate resistance at around $71 per share. If the stock can break above that level, it could rally to about $74, where the 38.2% Fibonacci retracement line rests. If the stock breaks back down and drops below $66.50, it should retest its multi-year low at around $64.50 per share, with further downside to as low as about $59.50 that were last seen in late 2010.
Near-term Keys: Given the strength of the stock’s downward trend, it’s hard to make a case for a bullish trade, and any such short-term trade should be considered very aggressive; however, if you don’t mind taking that risk you could use a break above $71 as a signal to buy the stock or work with call options with a near-term target between $74 and $75 per share. If the downward trend holds sway yet again, the stock could break below $66.50, which would act as a strong signal to short the stock or buy put options, with a near-term target at $64.50 if you want to take quick profits, or $59 if the stock builds even more bearish momentum.