As an analyst, I take a lot of interest in trying to find reasons the market stages some of the moves it makes. The factors, geopolitical, economic, or emotional, that drives trends over any time period can be widely varied, and sometimes it’s interesting to see not only what is influencing the market today, but also to look back and, with the advantage of hindsight, being able to evaluate whether a certain condition or element played a role in driving the market to the point it is at today.
Among the various macroeconomic factors I try to pay attention to is the ebb and flow of oil prices. I think oil is one of the most interesting commodities of all; no matter whether you drive a gas-guzzler, an electric vehicle or a hybrid, the truth is that oil is a factor in every sector of the market, with tentacles that reach into economic policy and most certainly into geopolitics.
Most of the market’s attention over the last couple of months has centered primarily around tariffs and the U.S.-China trade war, but in the last week has shifted to strongly focus on the advent of a new earnings season, with investors anxious to see not how much the trade war has impacted corporate profits, but also to analyze manager’s forward-looking comments for clues about its ongoing effects for the foreseeable future. An almost entirely ignored element of the economic picture right now is the ebb and flow of oil prices. That’s a little surprising as we move into late fall; the advent of a winter season usually gets analysts to start thinking about the opportunity for energy prices to increase as the world spends more to stay warm, including crude oil to natural gas. That’s one of the reasons I’ve started to turn my attention to some of the biggest stocks in the Energy sector.
ConocoPhillips (COP) is a well-known name, and generally categorized as one of the global “supermajor” oil companies. Compared to other stocks in the sector, COP may carry the best overall fundamental profile, but that strength hasn’t translated to price performance; over the last year, the stock is down a little over -22%. COP rebounded from a trend low at around $50 in late August to a short-term high a little above $62 in mid-September, but from that point dropped back to about $52 before turning back to the upside in the last couple of weeks. That’s a lot of volatility, but it also could be creating an interesting ABC technical pull back pattern that could be a catalyst to stronger near-term move to the upside.
Fundamentally speaking, COP has a lot going for it, with healthy cash flow and very manageable debt levels that have been a product of a strict focus by management over paying a high, unsustainable dividend or pushing for heavy production growth. The company’s production targets have emphasized short-cycle onshore work that produces immediate cash flows. Most analyst forecasts put WTI crude prices between $58 to $67 per barrel through 2019 and into 2020, which should translate well for COP to continue delivering solid cash flows and high profit margins. Does that make the stock a smart value? Let’s find out.
Fundamental and Value Profile
ConocoPhillips is an independent exploration and production company. The Company explores for, produces, transports and markets crude oil, bitumen, natural gas, liquefied natural gas (LNG) and natural gas liquids. The Company operates through five segments: Alaska, Lower 48, Canada, Europe and North Africa, Asia Pacific and Middle East, and Other International. The Alaska segment explores for, produces, transports and markets crude oil, natural gas liquids, natural gas and LNG. The Lower 48 segment consists of operations located in the United States Lower 48 states and the Gulf of Mexico. Its Canadian operations consists of oil sands developments in the Athabasca Region of northeastern Alberta. The Europe and North Africa segment consists of operations and exploration activities in Norway, the United Kingdom and Libya. The Asia Pacific and Middle East segment has exploration and production operations in China, Indonesia, Malaysia and Australia. COP’s current market cap is $62.5 billion.
Earnings and Sales Growth: Over the last twelve months, earnings declined more than -7%, while sales dropped a little over -9%. In the last quarter, earnings were mostly flat, but improved by 1%, while sales decreased a little over -16.5%. COP’s margin profile is impressive, with Net Income over the last twelve months that was 18.33% of Revenues, 18.85% in the last quarter.
Free Cash Flow: COP’s free cash flow is very healthy, at more than $7.87 billion for the trailing twelve month period and which translates to a Free Cash Flow yield of 12.6%.
Debt to Equity: COP has a debt/equity ratio of .45, a relatively low number that indicates the company operates with a conservative philosophy about leverage. They reported about $8.5 billion in cash and liquid assets in the last quarter, which along with operating profits that are more than adequate to service their debt, gives them excellent financial flexibility.
Dividend: COP pays an annual dividend of $1.68 per share, which increased from about $1.22 per share annually earlier this year, and which translates to a yield of 2.99% at the stock’s current price. There are other oil-related stocks that offer a much higher dividend yield right now, but I like the fact that COP has focused on the sustainability and quality of their dividend over trying to impress investors with a fat current yield they may be forced to cut down the road.
Price/Book Ratio: there are a lot of ways to measure how much a stock should be worth; but one of the simplest methods that I like uses the stock’s Book Value, which for COP is $29.79 per share and translates to a Price/Book ratio of 1.89 at the stock’s current price. Their historical Price/Book average is 1.78, which suggests that the stock is trading at a premium right now of -5.58%. Their Price/Cash Flow ratio offers an interesting counter-perspective, however since it is currently running about 53% below its historical averages. The historical Price/Book ratio puts the stock’s “fair value” target price at around $53, while the Price/Cash Flow valuation sets a much more attractive target around $86 per share.
Technical Profile
Here’s a look at the stock’s latest technical chart.
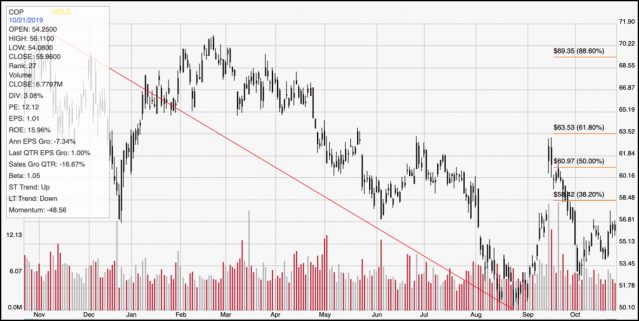
Current Price Action/Trends and Pivots: The red diagonal line traces the stock’s downward trend from November of last year to late August of this year; it also informs the Fibonacci retracement lines shown on the right side of the chart. The stock is forming an interesting stair-step, ABC pattern of higher lows, and if the stock can break above $57 in the next few days, it will also have a nice pattern higher highs to confirm the pattern even more. Near-term resistance is around $58.50 based on the Fibonacci retracement line, but a break above that level could give the stock even more rum to run, to between $62 and $63 where the 61.8% retracement level. A break below the latest pivot low at around $54 would invalidate the current ABC pattern and could mark a move lower to retest the stock’s trend low around $50.
Near-term Keys: Despite the difference between the stock’s Price/Book and Price/Cash Flow ratios, I think COP looks like a very interesting value-based opportunity at these current levels. If you aren’t afraid of the volatility that can associated with energy stocks, this is a stock that I think offers good long-term potential. If you prefer to work with short-term trades, a push above $57 could mark an interesting opportunity to work with call options or to buy the stock itself, with a short-term target around $58.50, or $62 if bullish momentum starts to pick up. If the stock starts to break down, a drop below $54 could be a signal to consider shorting the stock or buying put options with an eye on the $50 level to take profits on a bearish trade.