Being a contrarian investor can mean a few different things. One is that while most investors shy away from stocks that are trading at historically low levels, a contrarian will usually immediately see an opportunity to look for a terrific bargain. That’s at odds with the natural way of thinking; it’s a lot easier to to believe a stock is going to increase in price in the near future if you can see that it has already been moving higher.
Contrarian investing is often correlated with value investing, and I think that makes sense in a lot of ways. That includes the reality that all price trends – up or down – are finite in length and duration. That means that eventually, upward trend reverse down, and downward trends inevitably reverse up. Technical traders like to identify stages where those reversals become more likely as ways to start looking for signals to reverse the direction of their trading. It is also one of the keys I like to use to supplement my value analysis, and to increase the probabilities the stocks I work with could be good bargains and useful opportunities to profit from a reversal to a new upward trend.
The J.M. Smucker Company (SJM) is an interesting tale of two different trends throughout the course of the past year. From a multi-year low at around $94 at the beginning of the year, the stock rebounded strongly through the first six months of the year to a high near $128 per share in June. From that point, the stock’s strength faltered as the market pushed it back by nearly -23% to its current level a bit above $100 per share. The opportunity, I believe comes from the fact that the stock has been consolidating in an increasingly narrow range since the beginning of September, establishing a potentially strong baseline for a new move back to the upside. That could be even more true if market and economic pressures prompt investors to continue looking for “safe havens” to invest in, including stocks in generally defensive areas like the Consumer Staples sector. The stock’s fundamental profile isn’t perfect, but then few stocks right now are; the more important question is whether they’re good enough to support the stock’s value argument. Let’s look at the numbers.
Fundamental and Value Profile
The J. M. Smucker Company is a manufacturer and marketer of branded food and beverage products and pet food and pet snacks in North America. The Company’s segments include U.S. Retail Coffee, U.S. Retail Consumer Foods, U.S. Retail Pet Foods, and International and Foodservice. The Company’s U.S. retail market segments consist of the sale of branded food products to consumers through retail outlets in North America. In the U.S. retail market segments, the Company’s products are sold to food retailers, food wholesalers, drug stores, club stores, mass merchandisers, discount and dollar stores, military commissaries, natural foods stores and distributors, and pet specialty stores. In International and Foodservice, the Company’s products are distributed domestically and in foreign countries through retail channels and foodservice distributors and operators, such as restaurants, lodging, schools and universities, healthcare operators.SJM’s current market cap is $12.3 billion.
Earnings and Sales Growth: Over the last twelve months, earnings declined -11.24%, with sales growth also declining -6.5%. In the last quarter, earnings decreased -24%, with sales also declining an additional -6.5%. That points to increasing costs, which right now are coming from from foodstuffs as well as transportation costs. Despite the decline in earnings and revenues, SJM’s margin profile is improving; over the last twelve months, Net Income was 6.94% of Revenues, and increased in the last quarter to about 8.69%. These are signs the company is operating more efficiently right now than it was just a few months ago.
Free Cash Flow: SJM’s free cash flow is adequate, at a little over $789 million for the trailing twelve month period; that translates to a Free Cash Flow yield of about 6.39%.
Debt to Equity: SJM has a debt/equity ratio of .60, a relatively low number that indicates the company operates with a generally conservative philosophy about leverage. This number has decreased over the last few quarters from .73 as the company suspended stock buybacks and dividend increases to concentrate on debt paydown. A big portion of their long-term debt, which was about $4.8 billion in the last quarter comes from the acquisition of pet food company Ainsworth in May of 2018 for $1.7 billion. Cash and liquid assets are severely limited, at only $48.8 million. While their balance sheet for now indicates their operating margin is more than adequate to service their debt, the fact is that liquidity is a concern and could be a challenge in quarters to come.
Dividend: SJM pays an annual dividend of $3.52 per share, which translates to a yield of 3.25% at the stock’s current price.
Price/Book Ratio: there are a lot of ways to measure how much a stock should be worth; but one of the simplest methods that I like uses the stock’s Book Value, which for SJM is $70.21 per share and translates to a Price/Book ratio of 1.54 at the stock’s current price. Their historical Price/Book average is 1.88, which suggests that the stock is about 22.4% undervalue right now. Their Price/Cash Flow ratio offers an even more optimistic perspective, since it is currently running nearly 40% below its historical averages. That ratio puts a long-term target price at almost $152 per share.
Technical Profile
Here’s a look at the stock’s latest technical chart.
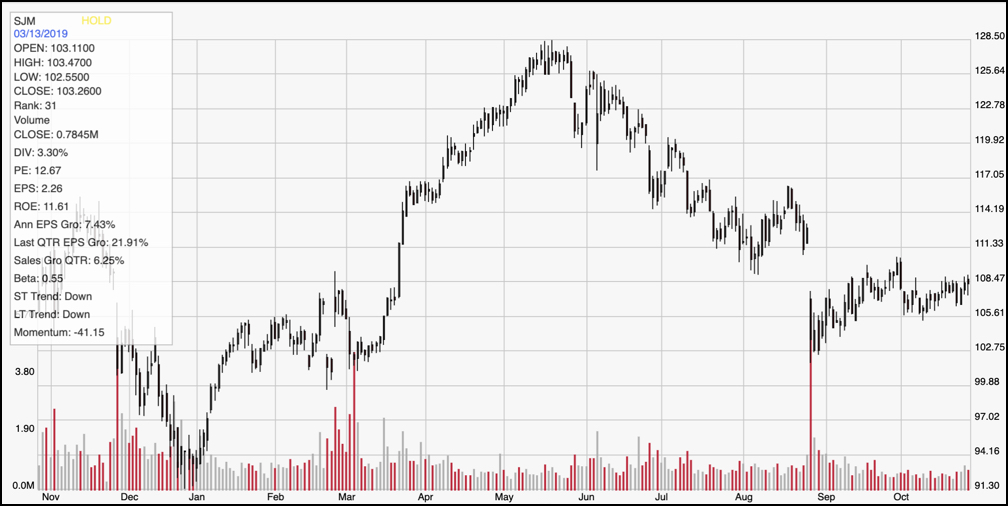
Current Price Action/Trends and Pivots: The chart above displays the stock’s price activity over the last year. Since June of this year, where it peaked at around $128 per share, to its trend low point in September at about $103, the stock has stabilized and consolidated in a narrow range between $109 and at resistance and $105.50 at support. A break above $109 could see the stock rally in the near term to between $111 and $114 based on previous pivots in that general price area. If the stock breaks below immediate support to $105, its next support level is a little below $103. If the stock picks up bearish momentum from that point, it could drop to anywhere between $97 and $99 before finding its next support level.
Near-term Keys: SJM’s consolidation range promises to offer some kind of opportunity for short-term, directional traders. A break above $109 would be an interesting signal to buy the stock or work with call options, while a drop below $105.50 could be useful to consider shorting the stock or working with put options. If you’re willing to work with a longer-term time frame, the stock’s value proposition is very interesting. If SJM can also show indications of improving liquidity in the quarters ahead, the value proposition could easily become compelling as well.