A little over a month ago in this space, I highlighted Goodyear Tire & Rubber Co. (GT) as a stock that offered a nearly compelling value argument. This icon of American business has really been beat down for most of the past two years, as broader industry trends pointed to weakening automotive sales growth on a global scale along with price volatility tied to oil prices as well as trade uncertainty. In many ways, the auto industry (and the stocks like GT that are tied to it) has acted as a proxy for uncertainty about tariffs between the U.S. and its trading partners since early in 2018, so I suppose it isn’t that surprising to have seen a number of the fundamental metrics that I use showing significant signs of deterioration in recent quarters.
Long downward trends often point to fundamental problems within a company, or an industry in general, and for most investors those kinds of trends are reasons to leave stocks in those segments of the market alone; they usually help to extend a downward trend even further. As a value-oriented investor with a fairly strong contrarian bent, however, one of things I’ve learned to do is to dig into these stocks for indications that the worst times might finally be in the past, and the company is set to forge ahead and offer smart investors an opportunity to apply Warren Buffett’s famous maxim, which is to buy “a good company at a nice price.”
As both the U.S. and China have actually started to acknowledge separately to media sources that progress is being made on the trade front, one of the biggest elements that has weighed on the industry for more than a year could finally be starting to ebb. If that’s true, it doesn’t mean that auto stocks like GT will be in position to rebound immediately; but it should bode well for the company’s fortunes in quarters ahead, and that is something that I would expect the market to use as a positive catalyst. The market has already pushed the stock about 16.5% higher in just the last month amid hopes that trade peace might finally be within sight, but even with that increase the stock still appears to represent a very interesting value proposition that might finally just be too good for a smart investor with a long-term perspective to ignore.
Fundamental and Value Profile
The Goodyear Tire & Rubber Company is a manufacturer of tires. The Company operates through three segments. The Americas segment develops, manufactures, distributes and sells tires and related products and services in North, Central and South America, and sells tires to various export markets. The Americas segment manufactures and sells tires for automobiles, trucks, buses, earthmoving, mining and industrial equipment, aircraft and for various other applications. The Europe, the Middle East and Africa (EMEA) segment develops, manufactures, distributes and sells tires for automobiles, trucks, buses, aircraft, motorcycles, and earthmoving, mining and industrial equipment throughout EMEA under the Goodyear, Dunlop, Debica, Sava and Fulda brands. The Asia Pacific segment develops, manufactures, distributes and sells tires for automobiles, trucks, aircraft, farm, and earthmoving, mining and industrial equipment throughout the Asia Pacific region, and sells tires to various export markets. GT’s current market cap is $3.8 billion.
Earnings and Sales Growth: Over the last twelve months, earnings declined almost -34%, while sales dropped about -3.2%. The picture improved significantly in the last quarter, with earnings increasing 80% and sales increasingly modestly by about 4.5%. GT is a company that historically operates with a narrow margin profile, but that in recent quarters had deteriorated, with the quarterly number less than half of the trailing twelve months. In the last quarter, Net Income as a percentage of Revenues was 2.31% versus just 1.28% in the last twelve months, marking an improvement that might not seem like much strictly in terms of the number itself; but the reversal to the normally expected positive difference is important.
Free Cash Flow: GT’s free cash flow measurement has been declining for the past four years, and was negative in June, at -$59 million over the last year. By comparison, in June 2018 Free Cash Flow that was almost $500 million a year ago. This is also a number that reversed to the positive in the last quarterly report, at $46 million (a positive improvement of more than $100 million).
Debt to Equity: GT has a debt/equity ratio of 1.24. That is a bit high, but this is actually a pretty typical pattern for most companies in the Auto Components industry, and isn’t alarming by itself. That said, GT’s liquidity, which was very healthy just a few years ago (more than $2 billion at the beginning of 2015) has been consistently declining since that point. As of the last quarter, the company had $917 million in cash and liquid assets against about $6.2 billion in long-term debt; this is also a number that declined in the last quarter. Their balance sheet indicates that they should be able to maintain their debt service without too much difficulty, with cash reserves that remain generally healthy despite their extended decline. A confirmation of GT’s improving fundamentals will be seen in the earnings report for the end of the year if debt continues to decline while liquidity remains consistent, or even better, increases.
Dividend: GT pays an annual dividend of $.64 per share, which translates to a yield of just a little over 3.8% at the stock’s current price.
Price/Book Ratio: there are a lot of ways to measure how much a stock should be worth; but one of the simplest methods that I like uses the stock’s Book Value, which for GT is $21.65 and translates to a Price/Book ratio of .76 at the stock’s current price. Their historical average Price/Book ratio is 2.11, which puts long-term target above $45 on the stock. That sounds incredibly tempting, but that I think is probably an unrealistic target, even on a long-term basis; however the stock is also trading almost 50% below its historical Price/Cash Flow ratio, which puts the stock’s long-term target at a still very interesting $32.50 per share.
Technical Profile
Here’s a look at the stock’s latest technical chart.
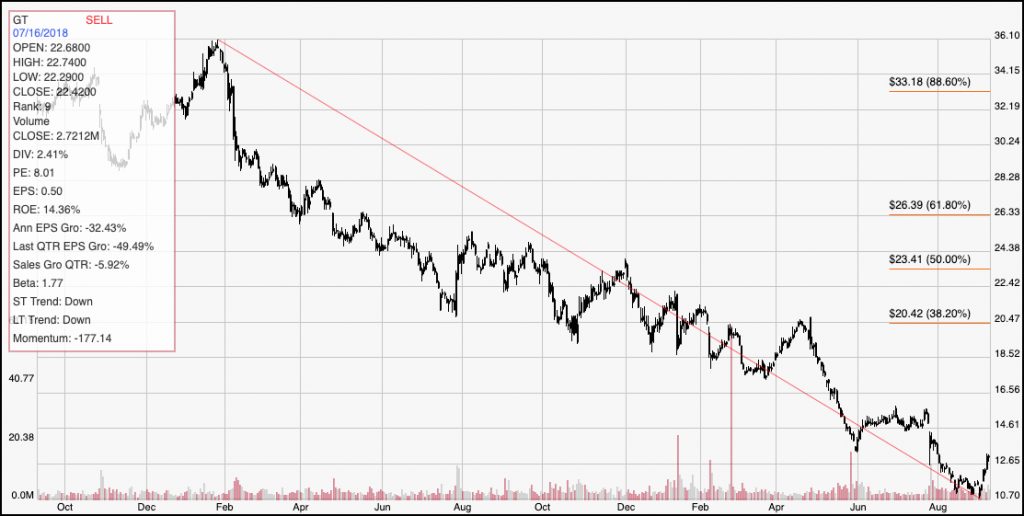
Current Price Action/Trends and Pivots: The diagonal red line traces the stock’s downward trend from November 2018 to now, and provides the reference for calculating the Fibonacci retracement levels indicated by the horizontal red lines on the right side of the chart. The stock is currently rebounding off of a multi-year low at around $11 in September and is showing positive bullish momentum from that point. In the last few days, the stock pushed above the 38.2% Fibonacci retracement line resistance a little below $16, and has held above that level; the stock’s most likely next immediate resistance is around $18 from pivot low seen in March of this year, with additional resistance at around $19 from the 61.8% retracement line. If the stock breaks back down below the 38.2% retracement line, which should now act as support, to about $15.75, it could drop to as low as about $13 based on pivots in that area in September and earlier this month.
Near-term Keys: A little over a month ago, GT looked like a classic example of a value trap; however it looks like this is a company that is turning a corner on its fundamental strength, and that could offer an interesting opportunity that I think is worth paying attention to. If you prefer to work with short-term strategies, the stock’s recent push above the 38.2% Fib line is a pretty solid bullish signal to consider buying the stock or working with call options, with an eye on an exit target between $18 and $19 per share. If the stock breaks down and drops below the 38.2% Fib line, a drop to $15.75 would likely mark a reversal of the stock’s short-term trend, which would provide a pretty strong signal to consider shorting the stock or working with put options with an on $13 as an exit point for a bearish trade.