Over the last few months, trade tensions and uncertainty have made stocks in the Industrial sector some of the most volatile in the marketplace. The thing that most investors tend to assume about volatility, however is that it is automatically negative, and can only drive prices lower. I believe the last few weeks have proven that notion to be patently false; positive progress in trade, along with the Fed’s continuing accommodative stance about interest rates and indications that global economic growth is healthier than many had thought it would be have all given investors reasons to feel pretty cheery as we move into the last two months of the year.
Oshkosh Corporation (OSK) is an excellent example of the effect volatility can have on a stock – both to the bearish and bullish side of things. In the course of a month from July to August, OSK dropped about -23% from a 52-week high (at that time) at around $86 per share. In the last month, however since finding a bottom at around $68, the stock has rebounded more than 28.5% higher, pushing to a new 52-week high in the last week. Among the stock’s catalysts was its most recent earnings report at the end of October, which exceeded analyst’s expectations and provided a strong indication that the company’s fundamentals remain on solid footing.
For investors who were able to take advantage of the stock’s September lows, its recent surge has certainly been a good thing; but what about for investors who are looking for a way to take advantage of what should be a fresh stage of bullish momentum for the broad market on the basis of trade optimism and broadly positive economic indicators? Does the stock’s strong move upward mean that it could keep moving higher, or has it passed the point where a conservative-minded, value-oriented investor should be willing to make a case for taking a position? Let’s dive in and find out.
Fundamental and Value Profile
Oshkosh Corporation (OSK) is a designer, manufacturer and marketer of a range of specialty vehicles and vehicle bodies, including access equipment, defense trucks and trailers, fire and emergency vehicles, concrete mixers and refuse collection vehicles. The Company’s segments include Access Equipment; Defense; Fire & Emergency, and Commercial. The Access Equipment segment consists of the operations of JLG Industries, Inc. (JLG) and JerrDan Corporation (JerrDan). The Defense segment consists of the operations of Oshkosh Defense, LLC (Oshkosh Defense). The Fire & Emergency segment consists of the operations of Pierce Manufacturing Inc. (Pierce), Oshkosh Airport Products, LLC (Airport Products) and Kewaunee Fabrications LLC (Kewaunee). The Commercial segment includes the operations of Concrete Equipment Company, Inc. (CON-E-CO), London Machinery Inc. (London), Iowa Mold Tooling Co., Inc. (IMT) and Oshkosh Commercial Products, LLC (Oshkosh Commercial). OSK has a current market cap of about $6.1 billion.
Earnings and Sales Growth: Over the last twelve months, earnings grew by 22%, while revenue increased 6.75%. In the last quarter, earnings dropped by -20% while sales declined -8.23%. The company operates with an operating margin that has historically been stable, and continues to demonstrate that quality; over the last twelve months, Net Income was about 6.91% of Revenues. This number was nearly identical in the last quarter, at 6.83%.
Free Cash Flow: OSK’s free cash flow is adequate, at about $409.2 million. This number marks a significant improvement from the middle of the year, from around $205 million.
Dividend: OSK’s annual divided is $1.20 per share, which translates to a yield of about 1.35% at the stock’s current price. That also marks an increase from $.96 per share, per annum around the middle of last year.
Price/Book Ratio: there are a lot of ways to measure how much a stock should be worth; but one of the simplest methods that I like uses the stock’s Book Value, which for OSK is $38.01 and translates to a Price/Book ratio of 2.34 at the stock’s current price. The stock’s historical average Price/Book ratio is 2.1, meaning that the stock is actually overvalued, by about -10% from that average. That doesn’t imply there is any upside to be had from a valuation standpoint; however the stock is also nearly 150% below its historical Price/Cash Flow average. I’m not sure I’m ready to put a long-term target price for OSK around $200 per share, since the stock has never been above $100 per share; but that does suggest there could still be a useful value-based opportunity, despite the stock’s impressive performance over the last month.
Technical Profile
Here’s a look at the stock’s latest technical chart.
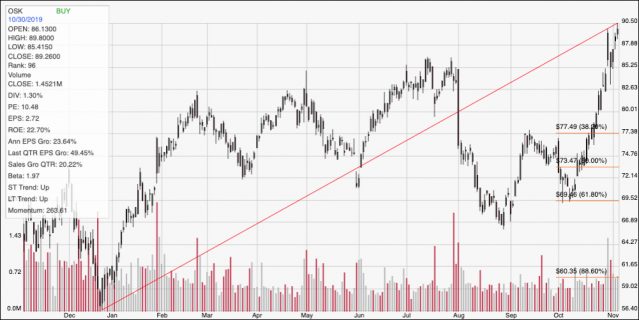
Current Price Action/Trends and Pivots: The red diagonal line measures the length of the stock’s upward trend from around $56 at the beginning of the year to now; it also informs the Fibonacci trend retracement lines shown on the right side of the chart. The stock’s upward trend is clear, along with its accelerating momentum in the last month. The stock is about $10 below its multi-year high around $100, which was last seen at the beginning of 2018 and should mark the most likely next significant resistance point for the stock’s current surge. If buyers start to take profits, which wouldn’t be surprising given the pace of the stock’s increase over the last few weeks, it should find support at around $85 per share, in-line with the stock’s pivot highs in July. A break below that point could see the stock drop back to between $82 and $80.
Near-term Keys: OSK’s current levels may not mark an ideal value opportunity, but there is an interesting case to be made for the stock to revisit the top end of the highs it visited at the beginning of 2018, and possibly to even extend them past that point. Truthfully, I think the best opportunity with OSK lies with short-term, momentum-based trades; the latest wave of momentum suggests that a bullish trade with call options, or simply buying the stock outright offers the best probability of success. Given the way the stock has surged over the last few days, I would expect the stock to retrace a bit at some point in the next few days. If it does, and finds a new support anywhere between the stock’s current price and $85, you can take that as a good signal to enter a new bullish trade. If the stock drops below $85, and you don’t mind the idea of working aggressively against the stock’s longer-term trend, you might consider shorting the stock, or working with put options with an eye on $82 to $80 as a price target for bearish trade.