Last month, I highlighted WDC. The semiconductor industry has benefitted all year long from positive news on the trade front, and WDC has followed that pattern as well – at least until the middle of September. From that point, the stock has strayed from the industry pattern, dropping a little over-18%. In the last few days, the decline has accelerated, as the stock dropped from a little above $60 to around $50 overnight after the company’s last earnings report at the end of October.
Why the drop? WDC’s fundamentals have been under pressure for almost two years amid indications storage and memory supply exceeded demand. Add trade stress that has impacted fundamental operations of the entire semiconductor industry, and it’s not surprising that the market was paying keen attention to the information WDC provided. It’s also probably natural, then to see the stock’s decline accelerating. Does that mean that the stock is at greater risk to keep dropping even more, or is this a good time to think about using the stock for a good value-based opportunity?
Fundamental and Value Profile
Western Digital Corporation (Western Digital) is a developer, manufacturer and provider of data storage devices and solutions that address the needs of the information technology (IT) industry and the infrastructure that enables the proliferation of data in virtually every industry. The Company’s portfolio of offerings addresses three categories: Datacenter Devices and Solutions (capacity and performance enterprise hard disk drives (HDDs), enterprise solid state drives (SSDs), datacenter software and system solutions); Client Devices (mobile, desktop, gaming and digital video hard drives, client SSDs, embedded products and wafers), and Client Solutions (removable products, hard drive content solutions and flash content solutions). The Company develops and manufactures a portion of the recording heads and magnetic media used in its hard drive products. WDC has a current market cap of about $15.5 billion.
Earnings and Sales Growth: Over the last twelve months, earnings declined by -97%, while revenue declined almost -20%. That pattern was also negative in the last quarter, where earnings decreased by -48.5%, while sales increased about 11%. Additionally, the company’s margin profile is a major red flag; the company’s Net Income has been negative over the last twelve months as well as the last quarter. The last quarter indicates that Net Income improved versus the last twelve months despite the fact they both remained negative. Even so, this is a strong indication of the negative effect trade has had on the company, along with broad industry pressures on memory and storage products that has kept prices and revenues down over the past year.
Free Cash Flow: WDC’s free cash flow been declining for quite some time, and appears to be approaching dangerous levels, at $470 million over the last twelve months. It’s important to note that at the beginning of 2018, Free Cash Flow was around $3.5 billion; this is a good reflection of the pressures that the company has been dealing with for almost two years.
Debt/Equity: WDC’s debt to equity ratio is 1.04. The company’s balance sheet indicates for the time being, they have good liquidity; however, if Net Income continues to be negative, WDC could have trouble servicing the debt they have. As of the last quarter, cash was about $3.25 billion while long-term debt is about $9.96 billion.
Dividend: WDC’s annual divided is $2.00 per share, which translates to a yield of about 3.79% at the stock’s current price.
Price/Book Ratio: there are a lot of ways to measure how much a stock should be worth; but one of the simplest methods that I like uses the stock’s Book Value, which for WDC is $32.32 and translates to a Price/Book ratio of 1.64 at the stock’s current price. The stock’s historical average Price/Book ratio is 1.694, meaning that the stock is currently only about 3% below that average. That isn’t very encouraging from a value-oriented perspective; however the stock is also about 29% below its historical Price/Cash Flow average, which provides a long-term target at around $69,
Technical Profile
Here’s a look at the stock’s latest technical chart.
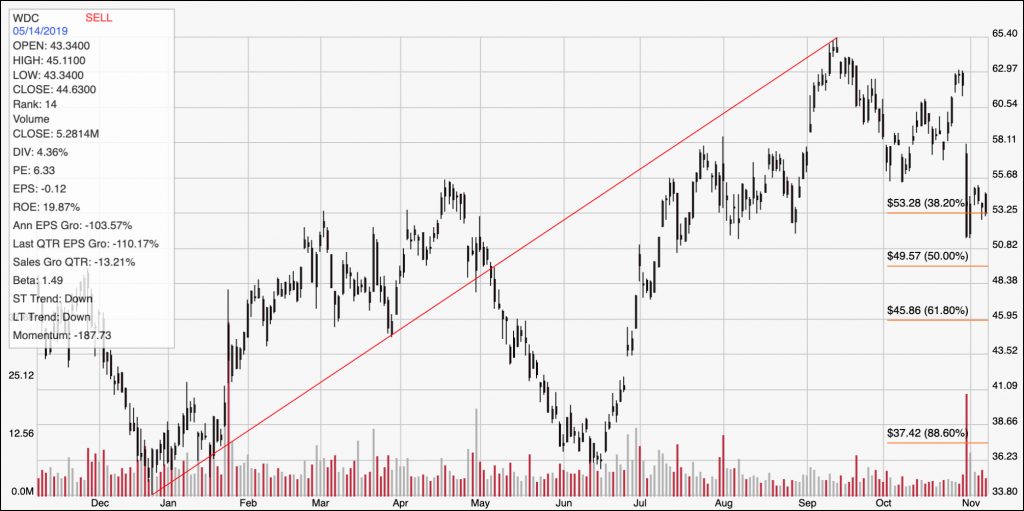
Current Price Action/Trends and Pivots: The red diagonal line measures the length of the stock’s upward trend from $34 in January of this year to its peak in September above $65; it also informs the Fibonacci trend retracement lines shown on the right side of the chart. Currently the stock is sitting a little above the 38.2% Fibonacci retracement line, which should provide support for the stock for the time being. If that is true, the stock could quickly bounce from its current level around $52 to its next resistance around $58 per share. A drop below that line, however, could see the stock drop to the 50% retracement level around $49.50, with $46 in sight from that point where the 61.8% retracement line sits.
Near-term Keys: WDC’s declining fundamentals make any kind of long-term view of the stock hard to foresee anything but risk right now. The stock could offer an interesting value if it drops to around $44, but until that point it’s just too risky. That means that if you want to work with this stock, you need to focus on short-term opportunities. If the stock bounces off of current support and start to move higher, you could use the bounce as a signal to buy the stock or work with call options with an eye on $58 as a near-term target price. A drop below $52, however is probably a good signal to think about shorting the stock or working with put options with an eye on $49.50 as a quick-hit target price, or $46 if bearish momentum really starts to pick up.