It’s no big surprise to say that trade tensions are continuing to play out at the forefront of investor’s famously short attention span. So far this week, rumors that the eagerly anticipated “Phase One” of a trade deal between the U.S. and China might not happen before the end of the year seem to have put the market back on edge. That means that, yet again, sectors that are particularly sensitive to global trade pressures are sitting right on the bleeding edge of opportunity and risk.
The hope, and certainly the expectation that a trade deal will be finalized sooner than later are among the reasons that the Semiconductor industry has been performing so well this year. As measured by the Philadelphia Stock Exchange Semiconductor iShares ETF (SOXX), in fact, the industry is up more than 48% year to date, even with current uncertainty taking a little off the top of the industry’s bullish trend in the last few days. The industry also got a bit of positive news this week as well even as speculation that the trade picture may not be as rosy as most hope is increasing, as the Trump administration renewed a temporary license for the company to engage in limited transaction with U.S. rural network operators, and also began issuing licenses for a limited number of U.S. companies to sell goods to Huawei. Both stand as a goodwill gesture to help move trade discussions along, which will hopefully add momentum to an eventual, long-term resolution.
There are a number of U.S. tech stocks, and semiconductor companies in particular, that stand to benefit from trade peace between the two largest economies in the world. Xilinx, Inc. (XLNX) certainly ranks high on that list, as it doesn’t manufacture its own products, instead relying on relationships with companies across the world, including China and other parts of the Asia-Pacific region to deliver its goods to customers all over the globe. Despite pressures from trade, the company’s fundamentals have held up pretty well; however, those same pressures have pushed the stock in an opposite direction to the rest of the industry. Since reaching a top at around $140 per share in April of this year, the stock is in a fairly extended downward trend, having dropped a little over -37% over that period to its current price around $90 per share. Does that decline spell opportunity for a contrarian-minded, value-focused investor?
Fundamental and Value Profile
Xilinx, Inc. (Xilinx) is engaged in designing and developing programmable devices and associated technologies. The Company’s programmable devices and associated technologies include integrated circuits (ICs) in the form of programmable logic devices (PLDs), including programmable System on Chips (SoCs) and three-dimensional ICs (3D ICs); software design tools to program the PLDs; targeted reference designs; printed circuit boards, and intellectual property (IP), which consists of Xilinx, and various third-party verification and IP cores. The Company provides design services, customer training, field engineering and technical support. Its PLDs include field programmable gate arrays (FPGAs), complex programmable logic devices (CPLDs) that its customers program to perform desired logic functions, and programmable SoCs, which combine (Advanced reduced instruction set computing (RISC) Machines (ARM)) processor-based systems with programmable logic in a single device. XLNX has a current market cap of $22.9 billion.
Earnings and Sales Growth: Over the last twelve months, earnings increased by 8.05%, while sales increased 11.67%. In the last quarter, earnings declined -3.09% while Revenues also dropped by almost -2%. XLNX’s Net Income versus Revenue is sturdy, and consistent; over the last year this number was 28.7%, and narrowed only slightly in the last quarter to 27.2%.
Free Cash Flow: XLNX’s Free Cash Flow is healthy, but modest at a little more than $1 billion. That translates to a mostly unremarkable, but adequate Free Cash Flow Yield of 4.33%.
Debt to Equity: XLNX has a debt/equity ratio of .46, which is a good reflection of the company’s conservative approach to leverage. Their balance sheet shows almost $2.5 billion in cash and liquid assets against just $1.245 billion in long-term debt. When you combine this element with their strong Net Income, I think it becomes easier to think that XLNX could be finding its own way through trade issues, and simply adjust to the “new normal” that ongoing tariffs are beginning to represent. It is also worth nothing that around June of this year, cash and liquid assets were about $3.2 billion, which I believe is a reflection of the headwinds related to trade the company has been contending with.
Dividend: XLNX pays an annual dividend of $1.48 per share, which at its current price translates to a dividend yield of about 1.62%. That is modest, but it is also less than 50% of the stock’s earnings per share over the last twelve months – a conservative payout ratio that actually helps bolster the company’s balance sheet strength.
Price/Book Ratio: there are a lot of ways to measure how much a stock should be worth; but one of the simplest methods that I like uses the stock’s Book Value, which for XLNX is $10.72 per share. At the stock’s current price, that translates to a Price/Book Ratio of 8.49. This is where the first cracks in XLNX’s bargain proposition really start to show up, since the stock’s historical Price/Book ratio by comparison is just 6.01 and puts the top end of the stock’s long-term price target more than -29% below the stock’s current price, at $64.44. The stock’s Price/Cash Flow ratio also makes the stock look overvalued; while the number is smaller, at -10.4%, it still puts the stock’s “fair value” around $65 per share and around levels it last saw in the latter half of 2018.
Technical Profile
Here’s a look at the stock’s latest technical chart.
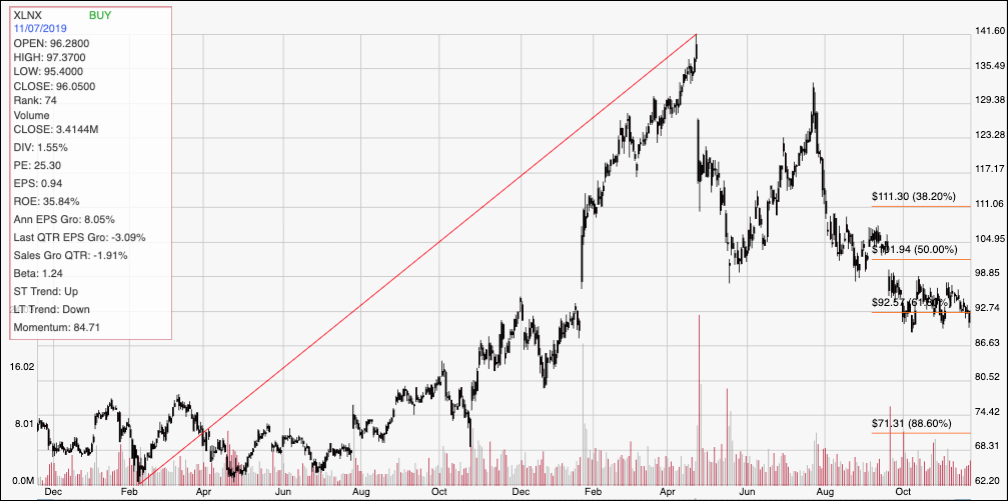
Current Price Action/Trends and Pivots: The red diagonal line defines the stock’s upward trend from February of 2018, to its long-term peak a year later at around $142 per share; it also informs the Fibonacci retracement lines shown on the right side of the chart. From that peak, the stock has dropped all the back to the 61.8% retracement line around $92.50, and is currently a little below that level. Interestingly, the stock is also showing an interesting consolidation pattern, with support around $89 at the stock’s lowest recent pivot low in October, and resistance around $98 from pivot highs in October and early November. A break above $98 could offer an interesting indication of a bullish trend reversal, with upside to about the $106 price level, and just a little below the 38.2% retracement line. A drop below $89, on the other hand could see the stock drop to around $80, which is about where the stock pivoted in late December of 2018 to start its strong rally to the April high around $140.
Near-term Keys: The stock’s fundamentals are strong, but the truth is that with the stock’s “fair value” significantly below its current price, there isn’t really any way to call XLNX a bargain right now. That said, the stock’s current consolidation pattern could offer a couple of interesting near-term opportunities. If the stock breaks above $98, you could consider buying the stock or working with call options with an eye on $106 as a short-term profit target. A bearish signal would come with a drop below $89, offering an opportunity to short the stock or to work with put options with an eye on $80 as a bearish closing target.