When technical traders see a stock’s price pattern diverging from its industry or sector, the question becomes whether that divergence represents an opportunity, or a risk. The commonly held principle that “a rising tide lifts all ships” usually means that if a broad segment of the market, such as the Consumer Discretionary sector, is performing well, most stocks in that sector should also be seeing strongly bullish movements. Through the first half of 2019, Consumer Discretionary was one of the top-performing sectors, but since August has moved in a mostly sideways pattern, and is slightly below its 52-week high point in July as measured by the S&P 500 Consumer Discretionary Sector SPDR (XLY).
If you look at many of the well-known names in the sector, including big-box retailers like Walmart (WMT), Target Stores (TGT), and even a number of specialty retailers like Best Buy (BBY) or Dick’s Sporting Goods (DKS), you might conclude the sector is in good shape. The latest earnings season was a good example, as several of these stocks posted better-than-expected quarterly numbers. I suppose that’s why divergent stocks like Foot Locker (FL) pique my interest. The stock is down a little over -40% since March, and more than -8% in the last month.
That reaction differs from the broader sector trend, but also tends to ignore some other elements that seem to indicate the company’s fundamental strength is actually improving. The stock had been rallying, even setting up a good, short-term upward trend until its latest earnings report, which prompted investors to dump the stock, dropping it from a peak at around $48 to its current level a little above $40. Is that drop a warning sign, or an indication that it might be a good time to take advantage of big value? Let’s find out.
Fundamental and Value Profile
Foot Locker, Inc. is a retailer of shoes and apparel. The Company operates through two segments: Athletic Stores and Direct-to-Customers. The Company is an athletic footwear and apparel retailer, which include businesses, such as include Foot Locker, Kids Foot Locker, Lady Foot Locker, Champs Sports, Footaction, Runners Point, Sidestep and SIX:02. The Direct-to-Customers segment is multi-branded and sells directly to customers through Internet and mobile sites and catalogs. The Direct-to-Customers segment operates the Websites for eastbay.com, final-score.com, eastbayteamsales.com and sp24.com. Additionally, this segment includes the Websites, both desktop and mobile, aligned with the brand names of its store banners (footlocker.com, ladyfootlocker.com, six02.com kidsfootlocker.com, champssports.com, footaction.com, footlocker.ca, footlocker.eu, runnerspoint.com and sidestep-shoes.com). FL has a current market cap of about $4.3 billion.
Earnings and Sales Growth: Over the last twelve months, earnings increased almost 19%, while revenues improved about 4%. In the last quarter, as earnings jumped a little over 71%, while sales rose nearly 9%. The company’s margin profile is an indication of strength, as Net Income as a percentage of Revenues over the last twelve months was 6.39%, and 6.46% in the last quarter.
Free Cash Flow: FL’s free cash flow is healthy, at $527 million over the last twelve months and which translates to a Free Cash Flow Yield of 12.25%.
Debt to Equity: FL’s debt/equity ratio is 1.17, which is generally an indication of high leverage. The balance sheet shows that long-term debt increased from only about $125 million in the first quarter of this year to a little over $2.8 billion in the last quarter. Cash and liquid assets are healthy, at $939 million. Their improving margin profile, healthy free cash flow and solid cash position means that even with the big jump in debt, operating profits are more than adequate to service the debt they have, while they also have good liquidity to provide additional flexibility.
Dividend: FL’s annual divided is $1.52 per share, which translates to a yield of about 3.76% at the stock’s current price. The dividend has also increased by about $.38 per share since the beginning of the year.
Price/Book Ratio: there are a lot of ways to measure how much a stock should be worth; but one of the simplest methods that I like uses the stock’s Book Value. FL has a Book Value of $22.67. That translates to a Price/Book value of 1.78, against a historical average Price/Book ratio of 2.946. That means that FL is undervalued by a little more than 65%. That puts the stock’s long-term “fair value” target price at about $67 per share, and back around its highest point in March of this year.
Technical Profile
Here’s a look at the stock’s latest technical chart.
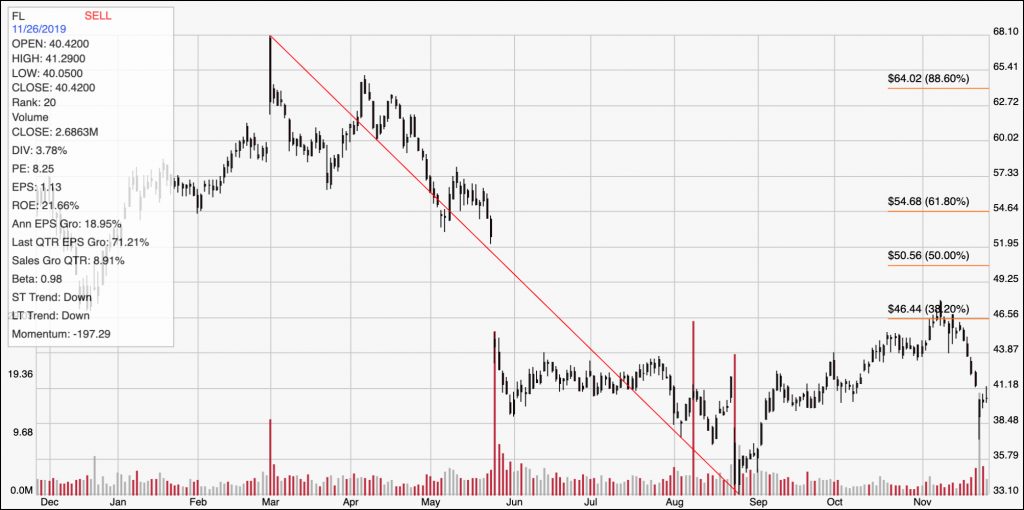
Current Price Action/Trends and Pivots: The chart above displays FL’s price performance over the last yeas. The diagonal red line traces the stock’s decline from March of this year to its low in August, and also serves as the baseline for the Fibonacci retracement lines on the right side of the chart. From that low point, the stock rallied to the 38.2% Fibonacci retracement line around $46.50 before dropping back over the last week or so to find new support around $40. If the stock can pivot higher from this current support, it should rally to about $44 before finding new resistance, with $46.50 the next likely peak if bullish momentum strengthens. If, however, the stock drops below $40, it could drop back near to its 52-week low point around $33 per share.
Near-term Keys: FL has a lot of interesting elements working in its favor as a potential value play, which means that as a long-term opportunity it could be hard to ignore – especially if you agree with many analysts that are using progress on trade and continuing signs of accommodation from the Fed in interest rate policy to predict continued economic strength in the foreseeable future. If, however you prefer to work with short-term trading strategies, you could use a push higher off of the stock’s current level as a sign to buy the stock or work with call options with an eye on $44 as a bullish target. If the stock drops below $40, consider shorting the stock or buying put options, with an eye on next support in the $33 to $35 range for a bearish trade exit point.