Mersana Therapeutics, Inc., a clinical stage biopharmaceutical company focusing on the development of antibody drug conjugate (ADC) for cancer patients with unmet need. The company develops Dolaflexin, a platform, which is used to generate a pipeline of proprietary ADC product candidates to address patient populations that are not amenable to treat with traditional ADC-based therapies. Its lead product candidate is XMT-1536, a Dolaflexin ADC targeting NaPi2b that is in Phase I clinical trial for the treatment of patients with ovarian cancer, non small cell lung cancer, and other orphan indications. Mersana Therapeutics, Inc. has a strategic research and development partnerships with Merck KGaA and Asana BioSciences, LLC for the development of ADC product candidates utilizing Fleximer. The company was formerly known as Nanopharma Corp. and changed its name to Mersana Therapeutics, Inc. in November 2005. Mersana Therapeutics, Inc. was incorporated in 2001 and is based in Cambridge, Massachusetts.
Long Term Trend
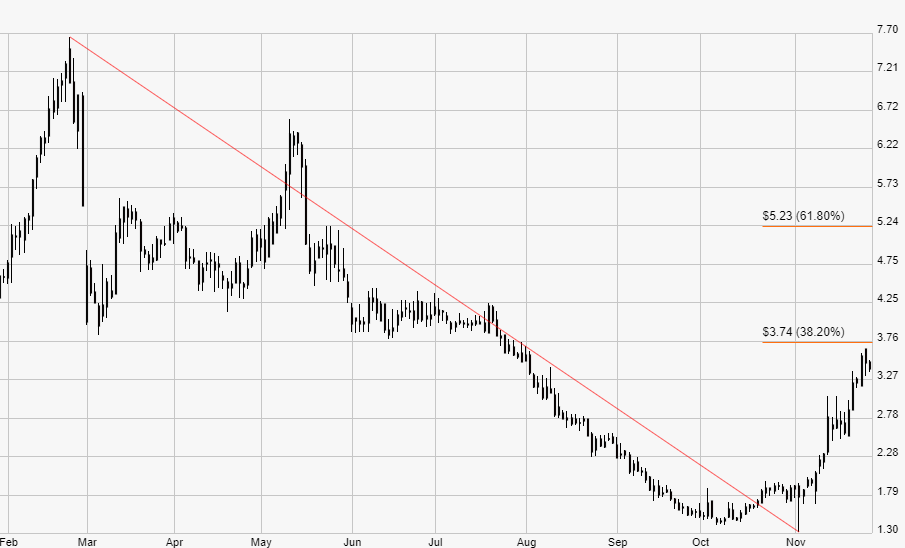
The long term trend of Mersana Therapeutics Inc is DOWN indicating that MRSN has experienced a DOWN trend for at least the past 180 trading days. Long term trends are key to understanding the starting point to the path of least resistance of a stocks price trend. The expected future trend bias is always strongest with the current trend.
Short Term Trend
The short term trend of Mersana Therapeutics Inc is UP, MRSN has been undergoing a short term UP UP over the past 7-10 days.
Signal
The current signal for Mersana Therapeutics Inc is BUY indicating that the stock could be Advancing in its trend. The current price trend is Extreme. Stocks in extreme levels of price trend should be allowed to move out of the extreme range before a buy or sell decision should be made. As is the case for most trending momentum style stocks, much of the “reason” price action is not often known until well into the price trend. But earnings growth and management efficiency are key components to a foundation to a sustainable uptrend. We will focus on fundamental indications that can build a case for reasons why the stock should continue its current trend.
Strength Rank
Rank is the rank of the stock vs. its peers. For example a Rank of 98 means the stock is out performing 98% of its peers over a 12 month period. A rank of 2 means the stock is outperforming 2% of its peers, in other words, 98% of its peers are out performing it. 98 is good, 2 is not so good. The current quarter is 40% of the weighting, so current performance is more significant to the rank.
The current rank for Mersana Therapeutics Inc is 86, this means that MRSN is out performing 86% of its peers. Stocks that have a rank of 80 or better, with support of all other analyses shown here, tend to advance the trend.
ROE – Return on equity is a measure of financial efficiency, gauging how much profit a company is able to generate from the company’s financial net worth (that is, assets minus liabilities). Look for an annual return on equity of at least 20%. That is the level that set apart the winning stocks from the ordinary. That doesn’t always mean that a company with smaller ROE is a poor investment. Some big winners have of course been shy of 20% return on equity when they started their major up trends. When ROE is strong, it gives investors an indication that the company is better poised to continue a solid earnings performance. A high ROE is only part of the fundamentals a solid company should have. Superb earnings and sales growth, superior profit margins and big operating cash flow are other key elements investors must seek.
The Current ROE for Mersana Therapeutics Inc is -41.14%, indicating MRSN is currently functioning with Low financial efficiency.
Annual EPS Growth – Companies with annual earnings growth of more than 20% are more likely to become leaders in up trending markets. While 20% Annual EPS growth is the minimum you should look for, don’t be afraid to seek even better results. Studies have shown that the greatest winners in the past 30 years had an average 30% annual EPS growth rate when they started their strong up trends. You also can look for three straight years of rising EPS growth, with an average of at least 25%. These performance results often imply that a company is growing fast even if the general economy is slowing down or even in recession.
The current Annual EPS Growth for Mersana Therapeutics Inc is 53.33% which is greater than the 30% average found is strong trending, fundamentally sound companies.
Quarterly EPS Growth – Outstanding earnings growth in the most recent quarters can be the single most important trait that identifies winners before they start their major price advances. Generally, the bigger the earnings growth, the better. Specifically, look for a company’s earnings per share up at least 25-30% vs. the year-ago level in the most recent quarter or two. Gains of 50%, 100% or more are typical of strong market leaders even before they make their huge price moves. There’s really nothing magic about this connection. Successful companies generate the strongest profit gains, regardless of the economic cycle. Even during periods when corporate profits are weak in general, you still find standouts that achieve massive earnings growth.
The current Quarterly EPS Growth for Mersana Therapeutics Inc is 2.78% which is less than the 25% average found is strong trending stocks even during or before huge price moves.
Quarterly Sales growth – A company’s annual and quarterly rate of increase in revenues (sales). A measure of growth and success as long as it is accompanied by an equally strong rate of increase in earnings per share. You want to see both in a potential investment. A company’s quarterly EPS gain should be supported by an increase in revenue (sales) of at least 25% or at least by an acceleration in sales growth in the past few quarters. You also should watch out for earnings growth that comes amid falling sales. Companies with declining revenue often boost their EPS results through layoffs or other cost cuts, especially in an uncertain economic environment. But this isn’t a sustainable approach, and it’s definitely not as desirable as profit gains that come from higher revenue. Recent quarterly sales results are more critical when it comes to researching stocks.
The current Quarterly Sales Growth for Mersana Therapeutics Inc is 317.82% which is greater than the 25% average found is strong trending stocks.