I suppose it’s appropriate that on Thanksgiving – the day retailers like to think of as “the day before Black Friday” – I’m focusing today on a company in the Consumer Discretionary sectors that produces many of most well-known apparel brands in the country. The last month has led the market to rally on the expectation that a trade deal will be reached sooner than later. The Fed continues to show an accommodative hand (even if the White House doesn’t seem to agree) in its approach to interest rates, and most economic indicators seem to be mostly favorable as well. That seems to have many investors buying into the “Goldilocks” economic target the Fed always talks about trying to hit – it’s neither too hot, nor too warm, but running along just right and should continue to do so for the foreseeable future.
Even with the rosy picture I just painted, I remain concerned about elevated risk in the market right now, and that is why I will continue to encourage investors to be cautious and conservative about taking on new positions. That doesn’t mean that you have to bearish; it just means that the smart approach is to be very selective about taking on new stocks. The “Goldilocks” target we are trying to hit strikes the right balance between keeping our money working for us while limiting and managing risk as much as practical means provide.
Being selective in my book means avoiding positions in stocks at elevated valuations, and trading at or near historical highs for the most part. That’s especially true in the most economically sensitive sectors and industries, like Technology, including semiconductors. Consumer Discretionary stocks, including retailers and apparel makers, fit into that description in a very broad sense as well. The caveat for me is where the stock’s price is relative to current market highs as well as its own historical extremes.
PVH Corp (PVH) is a good example. The stock is currently about $30 above its 52-week low at around $67, but is still sitting around -43% below its own highs, set in May of 2017. From that point, the stock has followed a very extended downward trend, but has turned into a short-term trend that appears poised to reverse that longer, bearish trend in a meaningful way. Backed up by solid fundamentals, the stock’s value proposition is nearly equal to its discount from that 2017 high. That’s why an actual trade deal could make a company like PVH a big near-term winner.
Fundamental and Value Profile
PVH Corp. is an apparel company. The Company operates through three segments: Calvin Klein, which consists of the Calvin Klein North America and Calvin Klein International segments; Tommy Hilfiger, which consists of the Tommy Hilfiger North America and Tommy Hilfiger International segments, and Heritage Brands, which consists of the Heritage Brands Wholesale and Heritage Brands Retail segments. The Company’s brand portfolio consists of various brand names, including Calvin Klein, Tommy Hilfiger, Van Heusen, IZOD, ARROW, Warner’s, Olga and Eagle, which are owned, and Speedo, Geoffrey Beene, Kenneth Cole New York, Kenneth Cole Reaction, Sean John, MICHAEL Michael Kors, Michael Kors Collection and Chaps, which are licensed, as well as various other licensed and private label brands. The Company designs and markets dress shirts, neckwear, sportswear, jeanswear, intimate apparel, swim products and handbags, footwear and other related products. PVH has a current market cap of $7.2 billion.
Earnings and Sales Growth: Over the last twelve months, earnings decreased about -3.4%, while sales were mostly flat, but positive by 2.5%. In the last quarter, earnings improved by nearly 48%, while revenues increased almost 9.5%. The company’s margin profile also is a sign of strength; over the last twelve months, Net Income was 6.57% of Revenues and improved to 8.08% in the last quarter.
Free Cash Flow: PVH’s Free Cash Flow is healthy, at $553 million. This is a number that has improved from a little more than $372 million in the final quarter of 2018, and that translates to a Free Cash Flow Yield of 7.46%.
Debt to Equity: PVH has a debt/equity ratio of .71, which is a pretty conservative number. Their balance sheet shows $433.5 million in cash and liquid assets against $4.27 billion of long-term debt. Both of these numbers have increased – cash from a little more than $400 million at the end of 2018, and debt more alarmingly from $2.9 billion since the end of the first quarter of 2019. Their solid, improving margin profile, combined with their healthy cash flow means that servicing their debt isn’t a problem.
Dividend: PVH pays an annual dividend of $.15 per share, which translates to a minimal dividend yield of just .15%. The stock’s dividend is not a defining reason to own the stock, but it is noteworthy that the stock pays a dividend, in an industry where most companies do not.
Price/Book Ratio: there are a lot of ways to measure how much a stock should be worth; but one of the simplest methods that I like uses the stock’s Book Value, which for PVH is $80.72 per share. At the stock’s current price, that translates to a Price/Book Ratio of 1.2. Their historical average is 1.67, which means the stock is undervalued by about 39%, and provides a good reference for the stock’s long-term potential upside, which is at about $135 per share.
Technical Profile
Here’s a look at the stock’s latest technical chart.
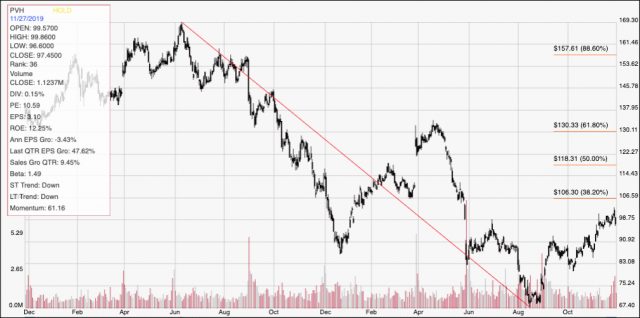
Current Price Action/Trends and Pivots: This chart displays the last two years of stock performance for PVH. From its all-time high at nearly $170 in June of last year to its low around $67 in late August, the stock dropped more than $100 per share. From that point, however, the stock has picked up some nice, positive momentum, driving to a recent high around $99 before dropping back just a bit this week. Immediate resistance, which I’m putting at that recent peak is at $99; if the stock can move above that level, short-term momentum should be strong enough to test the 38.2% Fibonacci retracement line a little above $106 per share. Immediate support is around $96; a drop below that point should give the stock to drop to around $90 before finding new support again.
Near-term Keys: If the stock can keep up its current, mostly bullish momentum, and break above $99, there is a strong signal to consider buying the stock or working with call options with a target price at around $106 as a near-term profit target. If the stock starts to break down, wait for a drop below $96 to act as a signal to short the stock or work with put options with an eye on $90 as a quick profit target, and possibly as low as $84 if bearish momentum remains strong. From a value-oriented standpoint, it’s hard to argue against the stock’s fundamental strength. If broad economic conditions remain favorable, there is no reason to think the stock shouldn’t be able to rise to the $135 target offered by my Price/Book analysis in the long term.