Trade tensions, which have persisted for well over a year, have worked to amp up market tension at different periods throughout the year. Over the last couple of months, encouraging signs for trade compromise have helped the market continue the rally that has extended all year long.
Autos have been shown to be particularly sensitive to trade issues. I don’t think that’s too surprising when you consider the reality that there really isn’t a major automaker that makes or sells their products exclusively in their own country. GM or Ford cars naturally use components manufactured all over the world, and so do Toyotas, Hondas, VW’s, BMW’s, and so on. Most of these companies use manufacturing facilities all over the world to produce vehicles for a specific market rather than shipping finished goods all over the world, and they all sell in each other’s home market. That’s why trade is such a big issue in this segment of the economy – and it isn’t just about the U.S. and China. Despite relative calm for the last several months between the U.S., Europe, and Mexico, tariffs still exist between the U.S. and those economies and have yet to be completely resolved. Those relationships may not be as acrimonious, but it does still exist, along with China as a headwind, and together they have continued to weigh on the profitability of the auto industry, along with tempering its prospects for the foreseeable future.
Cooper Tire and Rubber Co. (CTB) is one of only two publicly traded U.S. producers of rubber tires, along with Goodyear Tire and Rubber Co. (GT). As the smaller of the two, CTB operates in a more narrow niche, focusing on the replacement side of the business as opposed to selling tires for installation in new vehicles out of the factory. Both stocks have struggled year to date, and are showing signs that tariffs have negatively impacted their respective businesses. That may comes as a bit of a surprise since the company has a relatively limited scope of business exposure to China; however it does operate two of its segments in Europe and Latin America, and the company’s latest earnings report did refer to trade as a negative draw against their results. As a result, the stock has dropped more than -23% in the last month alone. Is the fundamental picture as bad as it might sound? Depending on the answer to that question, the stock’s current price could represent a new, interesting opportunity, or just another big risk to take under current conditions.
Fundamental and Value Profile
Cooper Tire & Rubber Company is a manufacturer and marketer of replacement tires. The Company specializes in the design, manufacture, marketing and sales of passenger car, light truck, medium truck, motorcycle, and racing tires. The Company operates through four segments: North America, Latin America, Europe, and Asia. The North America segment comprises its operations in the United States and Canada. The Americas Tire Operations segment manufactures and markets passenger car and light truck tires, for sale in the United States replacement markets. The Latin America segment comprises its operations in Mexico, Central America, and South America. The European segment has operations in the United Kingdom and the Republic of Serbia. Its the United Kingdom entity manufactures and markets passenger car, light truck, motorcycle and racing tires and tire retread material. As of December 31, 2016, the Company operated nine manufacturing facilities and 20 distribution centers in 10 countries. CTB’s current market cap is $1.5 billion.
Earnings and Sales Growth: Over the last twelve months, earnings declined almost -46%, while revenues declined by -4.55%. In the last quarter, earnings more than tripled, while sales improved by 3.68%. The company’s margin profile over the last twelve months is very narrow, at 1.61%, but strengthened in the last quarter to 4.16%.
Free Cash Flow: CTB’s free cash flow is negligible, at about $1.24 million over the last twelve month. It is especially worth noting that CTB’s Free Cash Flow is deteriorating; earlier this year it was $61.17 million, and negative at the end of the first quarter of 2018 at -$58.4 million. Its current level translates to a razor-thin Free Cash Flow Yield of .8%.
Debt to Equity: CTB has a debt/equity ratio of .14. This is a very conservative number. The company’s balance sheet demonstrates better liquidity and debt management than you might expect given its weak free cash flow pattern as cash and liquid assets in the last quarter were about $137 million while long-term debt was almost $181 million.
Dividend: CTB pays an annual dividend of $.42 per share, which translates to a dividend yield of about 1.43% at the stock’s current price.
Price/Book Ratio: there are a lot of ways to measure how much a stock should be worth; but one of the simplest methods that I like uses the stock’s Book Value, which for CTB is $25.28 per share. That number also translates to a Price/Book ratio of 1.16 at the stock’s current price. Their historical average Price/Book ratio is 1.88. That suggests the stock is trading right now at a discount of 61.5%. It is also trading almost 98% below its historical Price/Cash Flow ratio; together, these measurements translate to a long-term target price between $47 and $58 per share.
Technical Profile
Here’s a look at the stock’s latest technical chart.
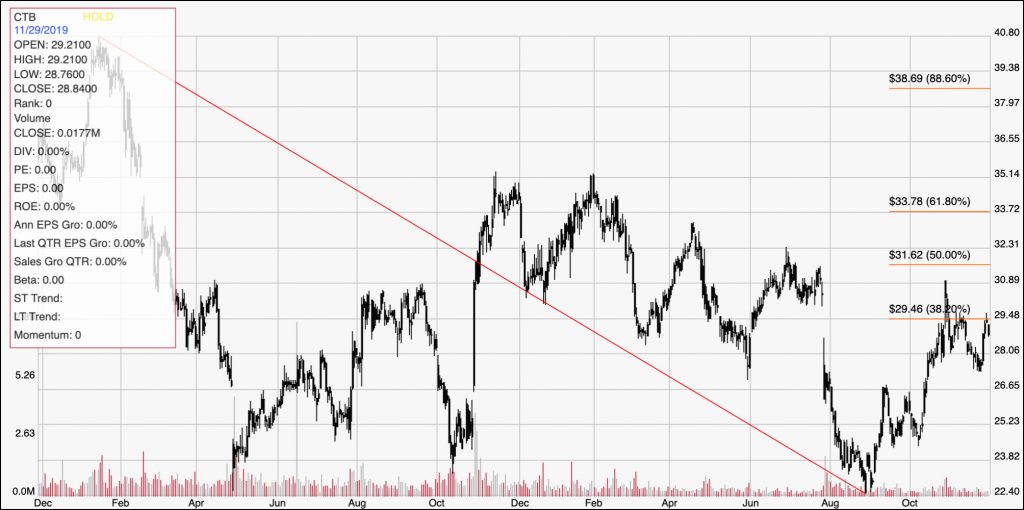
Current Price Action/Trends and Pivots: The chart above marks the last two year of price activity. The red diagonal line also provides a baseline for the Fibonacci retracement line shown on the right hand side of the chart. The bottom of the downward trend came at the end of August at around $22.50; from that point the stock has begun a good upward trend, testing resistance around the 38.2% Fibonacci retracement line at $29.50 before dropping back again. the stock is currently just a little below that point. A break above $29.50 could see the stock push in the short-term to its next resistance between about $32.50 and the 61.8% retracement line around $33.75. Current support is back around the last pivot low at around $27.50. A drop below that level could see the stock drop to around $24 before finding new support again.
Near-term Keys: The stock’s value metrics might make the stock seem like a tempting opportunity right now. The truth is that the fundamental picture is better than I expected, with the company showing some resilience based on its mostly solid balance sheet and improving Net Income. That said, the erosion of its Free Cash Flow continues to be a sign that the company’s liquidity and cash is being chipped away a bit at a time, which I think is a reflection of the effect of tariffs and trade. This is a small company that operates with a conservative management approach that has helped it weather the storm so far, but the longer the storm rages, the more battered it is likely to get. If you prefer to look for a short-term trade, a push above $29.50 could give the stock room to rally to somewhere between $32.50 and $33.75 per share, proving a good opportunity to buy the stock or work with call options. If you prefer to look for a bearish trade, look for a drop below $27.50 as a signal to consider shorting the stock or working with put options, with an eye on $24 as a bearish profit target point.