Any experienced investor, no matter what their investment philosophy is, will undoubtedly tell you that one of the most useful ways they keep track of new opportunities as they come up is by maintaining a watchlist of stocks that they can check on a regular basis. A good, diversified list of stocks in a variety of different industries can be an effective way to keep your investing functional, no matter what the ebb and flow of market sentiment is doing at any given time, since as one industry may be moving out of favor with investors, another will undoubtedly be moving into favor.
As a value-oriented investor, I get a little more interested when I see stocks falling out of favor with the broad market. Institutional rotation away from a sector usually means that there is a lot of money getting pulled out of stocks in a certain sector of the market, and so that usually puts a lot of pressure on just about everything related to that sector. That creates downward trends and bargain pricing levels, even for the biggest players in those industries that I can take advantage of.
The contrarian nature of value investing is a bit at odds with the importance I also put on technical analysis. Looking for opportunities to buy a stock ultimately means that the objective – even with a long-term view in mind – is to see the stock increase in price. That’s why I also like to work with stocks that, while trading at significant discounts or even at the low end of their historical ranges, have also begun to show signs of stabilization, or even moving into short-term upward trends. Today’s highlight is a good example of a stock that has been showing signs of bullish strength in the last couple of months but is still showing attractive valuation levels.
Eastman Chemical Co. (EMN) is one of the biggest companies in the Chemicals industry, and that has acted as a proxy for the effect of tariffs over the past year. EMN was one of the first companies earlier this year to begin citing the effects of trade exposure on their quarterly earnings results, but even so the company’s fundamental profile has remained pretty solid, if not altogether unaffected. The stock itself struggled in the midst of a downward trend that began in March of 2018 at around $112.50 and saw the stock hit a multi-year low at around $61 early in September. It has rallied strongly from that point since, increasing in price about 28% as of this writing. That is creating an interesting opportunity to re-evaluate the stock’s prospects as a useful value-based investment.
Fundamental and Value Profile
Eastman Chemical Company (Eastman) is an advanced materials and specialty additives company. The Company’s segments include Additives & Functional Products (AFP), Advanced Materials (AM), Chemical Intermediates (CI), and Fibers. In the AFP segment, it manufactures chemicals for products in the coatings, tires, consumables, building and construction, industrial applications, including solar energy markets, animal nutrition, care chemicals, crop protection, and energy markets. In the AM segment, it produces and markets its polymers, films, and plastics with differentiated performance properties for end uses in transportation, consumables, building and construction, durable goods, and health and wellness products. The CI segment leverages large scale and vertical integration from the cellulose and acetyl, olefins, and alkylamines streams to support its specialty operating segments. Its product lines in Fibers segment include Acetate Tow, Acetate Yarn and Acetyl Chemical Products. EMN’s current market cap is $10.7 billion.
Earnings and Sales Growth: Over the last twelve months, earnings declined a little more than -17.1% while revenue dropped about -8.7%. Those numbers improved significantly in the last quarter; earnings declined almost -2.5% while sales were down -1.61%. The company’s margin profile is healthy and showing signs of strength. Net Income for the last twelve months was 8.12% of Revenues, and increased modestly to about 11.4% in the most recent quarter.
Free Cash Flow: EMN’s free cash flow is healthy, at $1.12 million. This is a number that has increased significantly since 2017, from about $650 million.
Debt to Equity: EMN has a debt/equity ratio of .91, implying they use a fair amount of debt, but it is also worth noting that this number decreased from a little above 1 earlier in the year. The company’s balance sheet indicates their operating profits are more than adequate to service their debt for the time being, however liquidity could be a concern moving forward. Their balance sheet shows $207 million in cash and liquid assets versus about $5.5 billion in long-term debt.
Dividend: EMN pays an annual dividend of $2.48 per share, which translates to a yield of about 3.16% at the stock’s current price.
Price/Book Ratio: there are a lot of ways to measure how much a stock should be worth; but one of the simplest methods that I like uses the stock’s Book Value, which for EMN is $44.84 and translates to a Price/Book ratio of 1.75 at the stock’s current price. Their historical average Price/Book ratio is 2.46, suggesting the stock is undervalued by more than 41%. In addition, the stock is also trading 26% below its historical Price/Cash Flow ratio. Together, these two measurements offer a long-term target price between $99 and $111 per share.
Technical Profile
Here’s a look at the stock’s latest technical chart.
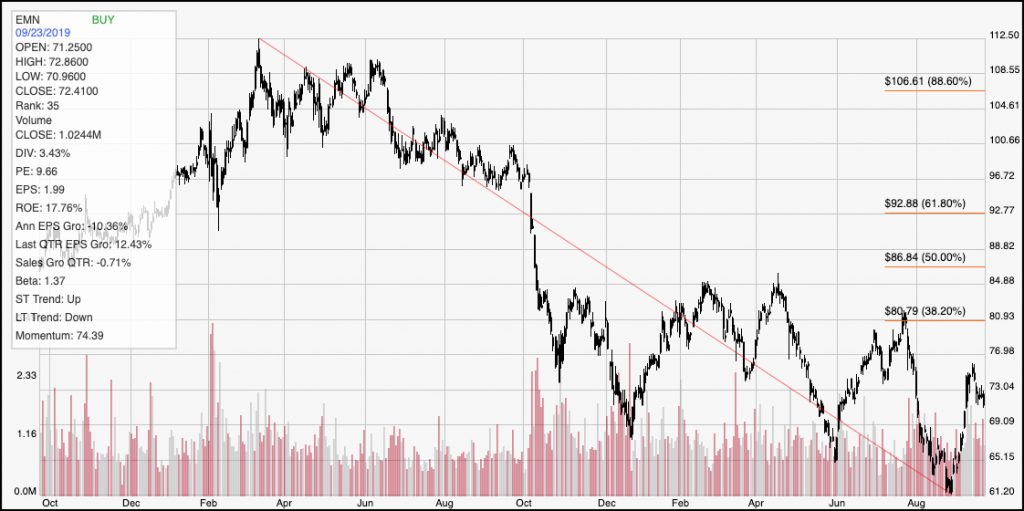
Current Price Action/Trends and Pivots: The diagonal red line traces the stock’s downward trend from February 2018 to its low in early September; it also provides the reference for calculating the Fibonacci retracement levels indicated by the horizontal red lines on the right side of the chart. EMN has rallied from that low point at around $61, building a solid upward trend that peaked a little above the 38.2% Fibonacci retracement line around $83 per share. More recently the stock dropped to support at around $77, but is stabilizing a little above that point in the last week or so. A drop below $77 could see the stock decline back to around $69 before finding its next support, while a resumption of its bullish trend gives the stock to run from around $78 to its recent peak at around $83 per share.
Near-term Keys: The value proposition right now for EMN remains very attractive, with improving fundamental strength to back it up. If you prefer to work with short-term trading strategies, there could be a good opportunity right now to buy the stock or work with call options with an eye on $83 as a bullish profit target. A drop below $77 would be a good signal to short the stock or work with put options, with a bearish profit target around $69.