Is a trade deal between the U.S. and China imminent, or are comments from the Trump administration that delaying an agreement might actually be a superior option more than idle speculation meant to keep outsiders guessing? The truth is that no one really knows until a deal is actually announced; until that happens, the market is going to continue to speculate, which means that it is also going to remain volatile for the foreseeable future.
Uncertainty translates to volatility, and generally speaking volatility means that investors are going to be anxious to find “safe havens” for their money. Safe havens can include extremely conservative instruments like bank savings, CD’s or Treasury bills; they can also include stocks in areas of the market that tend to be less sensitive to economic cycles.
Molson Coors Brewing Company (TAP) is a stock in a sector, Consumer Staples, that tend to hold up pretty well under uncertain economic conditions. That’s because when the economy is in decline, consumers still need to buy food and home supplies. That includes the so-called “sin stocks” – companies like TAP that provide alcoholic beverages along with other products that have historically continued to generate strong revenues even as consumers are forced to start tightening their belts.
The truth is that even with uncertainty – including indications that extended tariffs between the U.S. and just about all of its largest trade partners are among the biggest headwinds that are forcing a global economic slowdown – increasing, we’re still a long way off from seeing an actual recession. That means that while stocks in various parts of the Consumer Staples sector might continue to be attractive, there are still some risks to be seen. In the case of TAP, the largest brewing company in the U.S. is in the midst of a long-term, extended downward trend that began in January of 2018, at a peak of nearly $86 and is testing the extreme low end of that trend at a low around $50. That’s a -42% drop that would pique the interest of most value investors. Is that an opportunity to buy a good stock at a nice price, or is this an example of the market’s ability to effectively price fundamental weakness into a stock?
Fundamental and Value Profile
Molson Coors Brewing Company (MCBC) is a holding company. The Company operates as a brewer. The Company’s segments include MillerCoors LLC (United States segment), operating in the United States; Molson Coors Canada (Canada segment), operating in Canada; Molson Coors Europe (Europe segment), operating in Bulgaria, Croatia, Czech Republic, Hungary, Montenegro, Republic of Ireland, Romania, Serbia, the United Kingdom and various other European countries; Molson Coors International (Molson Coors International segment), operating in various other countries, and Corporate. The Company brews, markets, sells and distributes a range of beer brands. The Company offers a portfolio of owned and partner brands, including Carling, Coors Light, Miller Lite, Molson Canadian and Staropramen, as well as craft and specialty beers, such as the Blue Moon Brewing Company brands, the Jacob Leinenkugel Brewing Company brands, Creemore Springs, Cobra and Doom Bar. TAP’s current market cap is $11.1 billion.
Earnings and Sales Growth: Over the last twelve months, earnings declined a little over -19.5%, while sales declined -3.51%. In the last quarter, earnings declining -2.63% and sales at -3.37%. TAP’s margin profile is deteriorating, with Net Income over the last twelve months that was just 1.18% of Revenues, and -14.17% in the last quarter.
Free Cash Flow: TAP’s free cash flow is healthy, at a little over $1.3 billion for the trailing twelve month period. That translates to a Free Cash Flow yield of 12.3%.
Debt to Equity: TAP has a debt/equity ratio of .60, a relatively low number that indicates the company operates with a generally conservative philosophy about leverage. Despite their impressive margin profile, the company doesn’t have great liquidity, with cash and liquid assets that have declined from about $750 million at the end of 2018 to $410 million in the last quarter, against $8 billion billion in long-term debt. It is true that since the end of 2018 the company has cleared more than $1.5 billion in long-term debt from their balance sheet. The fact, however that the company’s Net Income means that TAP is spending more than they’re making means that their ability to continue servicing their debt is very much in question.
Dividend: TAP pays an annual dividend of $2.28 per share, which translates to a yield of 4.46% at the stock’s current price. TAP is also increasing their dividend payout, which looks nice, but in reality is a problem, since their dividend payout ratio is more than 3 times earnings – a level that simply isn’t sustainable in the long term.
Price/Book Ratio: there are a lot of ways to measure how much a stock should be worth; but one of the simplest methods that I like uses the stock’s Book Value, which for TAP is $61.98 per share and translates to a Price/Book ratio of .82 at the stock’s current price. Their historical Price/Book average is 1.69, which suggests that the stock is trading at a discount right now of more than 104%. Their Price/Cash Flow ratio offers an even more optimistic perspective, since it is currently running 278% below its historical averages. Between the two measurements, the long-term target price, based strictly off of value analysis could lie anywhere in a range between $104 and $142 per share. The low end of that range is about where the stock’s all-time highs, reached in late 2016 lie.
Technical Profile
Here’s a look at the stock’s latest technical chart.
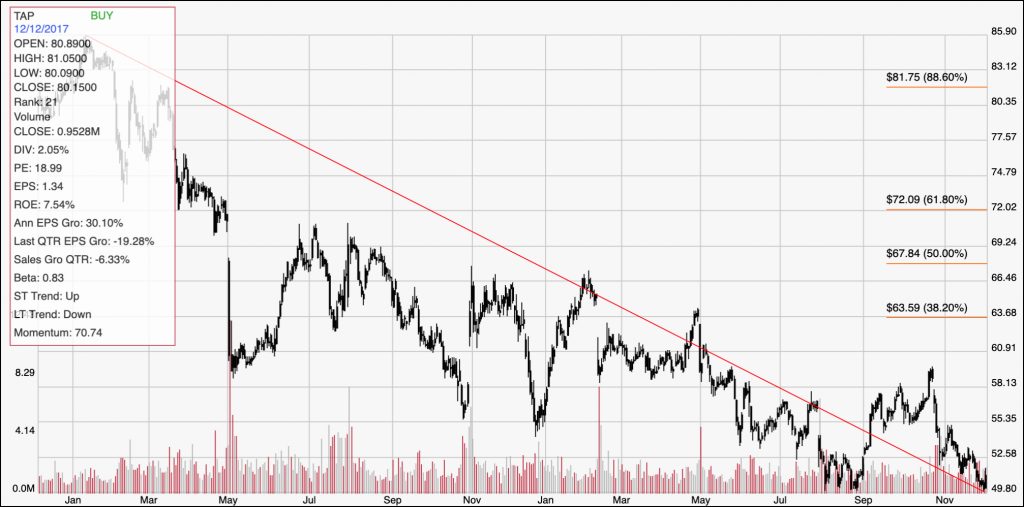
Current Price Action/Trends and Pivots: The chart above shows the entirety of the stock’s downward trend over the last two years. Since the end of August, the stock has used the $50 level as support, including a bounce off of that level in just the last few days. The stock has immediate resistance in the $52.50 range, but would probably need to break above $55, to about $55.50 to offer any kind of sustainable downward trend. If the stock’s current support level doesn’t hold, its next most likely support range would likely be around $48 based on pivots last seen in 2013.
Near-term Keys: The value proposition on TAP Looks compelling, but given the stock’s fundamental weaknesses, I don’t think there is any way to justify using the stock as a long-term buying opportunity. Given the strength of the downward trend, a short-term trade on the bullish side is also very speculative right now, no matter whether you want to buy the stock outright or work with call options. A drop below the stock’s current support at $50 could be an interesting signal to short the stock or start using put options, with a near-term target price in the $47 to $48 range, with even more downside from there if bearish momentum picks up.