The holiday season is in full swing, and this year that seems to be motivating investors to keep betting on good news. That seems to be coming in the face of conflicting accounts of progress on the trade front; while the White House, including President Trump suggests that a trade deal is neither imminent nor needed in the near term, Chinese officials continue to express optimism that positive progress is being made and that a compromise could be reached soon. Posturing? Almost certainly. Perhaps that’s why the market seems intent on betting on a positive result, sooner than later.
Trade peace is something that I expect, as do most investors, should give the market the biggest catalyst to remain bullish. We’re starting to move into year eleven of the longest bull market in recorded history – something that I find both remarkable, unexpected, and a little nerve-wracking. Are all of the rules that most of the principles about economics are based on being rewritten? I don’t think so; but I do think that there is an unprecedented level of financial engineering taking place, from political leaders to central banks across the globe. That, along with an eventual trade deal, could keep the market’s momentum moving in a positive direction for the foreseeable future, and that is something that should be a positive for business, including the retail sector in general.
Retail stocks have generally been consolidating at the top of their own, extended bullish trend; but one of the stocks that had already been diverging from the industry has done so even more dramatically since its last earnings report. Kohl’s Corporation (KSS) is down nearly -17% in the last month, with almost all of that drop coming overnight, when the stock plunged more than $12 per share overnight after its earnings report underwhelmed investors. KSS is a stock that is in the midst of a transformation, as it works to keep up with bigger names in the industry including Walmart (WMT), Target Stores (TGT) and, of course, Amazon (AMZN). WMT and TGT have been able to find ways to compete effectively, while AMZN continues to put pressure on practically every segment of the retail sector; but investors seem leery of KSS’s ability to find its own way to succeed as a brick-and-mortar retailer in an increasingly online world. Is the stock’s decline a telling indication of the market’s ability to price fundamental strength (or, perhaps in this case, weakness) into a stock’s price, or is this really an opportunity to buy a well-known name at the bottom?
Fundamental and Value Profile
Kohl’s Corporation (Kohl’s) is an operator of department stores. The Company operates approximately 1,154 Kohl’s department stores, a Website (www.Kohls.com), approximately 12 FILA outlets, and approximately three Off-Aisle clearance centers. The Company’s stores and Website sell moderately-priced private label and national brand apparel, footwear, accessories, beauty and home products. The Company’s Website includes merchandise that is available in its stores, as well as merchandise that is available only online. The Company’s merchandise mix includes both national brands and private brands that are available only at Kohl’s. The Company’s private brands include Apt. 9, Croft & Barrow, Jumping Beans, SO and Sonoma Goods for Life. The Company’s exclusive brands include Food Network, Jennifer Lopez, Marc Anthony, Rock & Republic and Simply Vera Vera Wang. KSS’s current market cap is $7.5 billion.
Earnings and Sales Growth: Over the last twelve months, earnings and sales both declined, with earnings -24.5% lower, whiles sales were flat, but a bit negative, at -0.06%. In the last quarter, the pace of decline more than doubled, with earnings almost -52.5% lower, while sales actually improved by 4.4%. The company’s margin profile has historically been narrow, but is showing signs of deterioration. In the last twelve months Net Income was 3.5% of Revenues, and narrowed to 2.65% in the last quarter. Earlier this year, however, the quarterly number was only about 1.5%, implying that while costs appear to be increasing, the stock could be turning a corner in the quarters ahead.
Free Cash Flow: KSS’s free cash flow is generally healthy, at $931 million. That translates to a Free Cash Flow Yield of 12.4%, which admittedly is impressive given their narrowing Net Income; but it should also be noted that earlier this year free cash flow was markedly higher, at about $1.7 billion.
Debt to Equity: KSS has a debt/equity ratio of 1.09, which also marks an increase from .7 earlier this year. The company’s balance sheet reflects a shift from the last quarter of 2018. Cash and liquid assets are almost 50% lower, to about $625 million, while debt increased from $400 million in the middle of last year to $4.5 billion in the most recent quarter. Along with the stock’s deteriorating Net Income, this is an indication that the company’s liquidity, along with their ability to service their debt is in question.
Dividend: KSS’ dividend is $2.68 per share, which translates to an attractive annualized yield of about 5.68% at the stock’s current price.
Price/Book Ratio: there are a lot of ways to measure how much a stock should be worth; but one of the simplest methods that I like uses the stock’s Book Value, which for KSS is $33.65. At the stock’s current price, their Book Value translates to a Price/Book ratio of 1.4 versus an average Price/Book ratio of 1.86, which means the stock is undervalued by almost 33%. That offers a long-term target price at around $62.50, a level that is supported by the stock’s Price/Cash Flow ratio, which is also 33% below its historical average.
Technical Profile
Here’s a look at the stock’s latest technical chart.
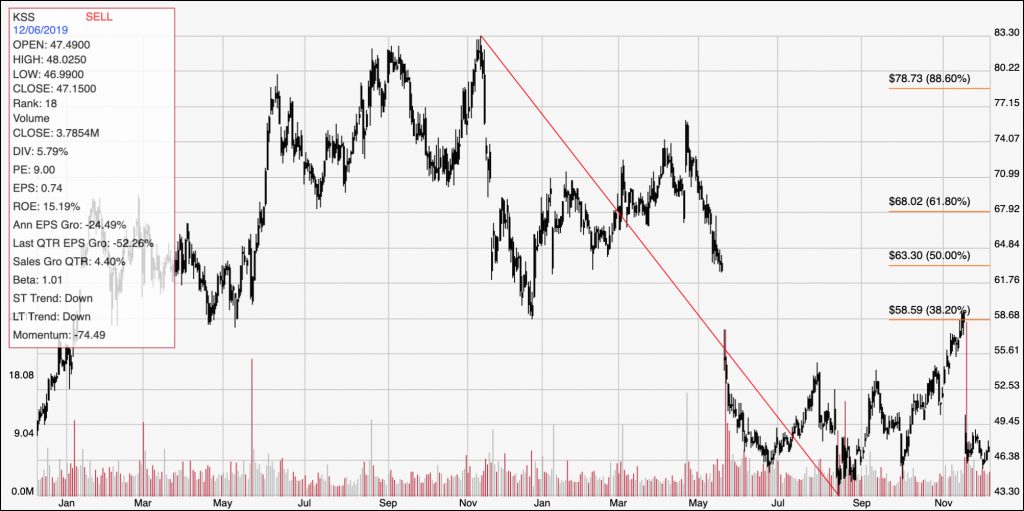
Current Price Action/Trends and Pivots: The chart above shows the last two years of price movement for KSS. The downward trend to the end of August is clear, dropping from a high around $83 to a low at around $43. From that point, the stock staged a strong rally, pushing to the 38.2% Fibonacci retracement line at around $58.50 before its last earnings report plunged the stock back near to its 52-week lows. Current support is just a little below the stock’s current price, at around $47 per share; a break below that level should see the stock test its multiyear low back at $43, with room from there if bearish momentum continues to as low as $38 to $39 per share. Current resistance is around $48.50; if the stock can break that level, it could rally to around $51 before finding its next resistance level.
Near-term Keys: Despite the stock’s discounted price based on recent performance, I don’t think it’s a good time to think of KSS as a strong value candidate. The company is in the midst of a transformation effort that includes reducing its reliance on third-party brands and a partnership with AMZN to facilitate product returns on a localized basis. Analyst opinions about the benefits of their Amazon alliance seem to be mixed, and so until management can demonstrate that their strategy is working in a way that benefits the bottom line and strengthens the company’s balance sheet, I think the greatest probabilities lie on the bearish side. A break below support at $47 could offer an opportunity to short the stock or work with put options with a target price at around $43 per share. If the stock can start to build bullish momentum with a bullish break to about $49, the stock could rally in the near-term to as high as $51. The downward gap, however is likely to keep a lid on any near-term bullish momentum, which is why I think the smarter bet with KSS right now is to wait and see what may come in future earnings reports