Sunday, December 15 is starting to loom large for investors across the market, as the deadline for a new set of tariffs on Chinese goods approaches. Investors have been betting heavy that a trade deal is going to be finalized by the end of the year, and before the deadline, for most of the past couple of months. That has translated to nice gains for most of the market, including the sectors and industries that are particularly exposed to trade and tariff risk. Since the beginning of November, for example, the Tech sector is up a little over 5%, but over the past week has come slightly off of its high point at the beginning of this month.
One of the stocks I’ve been following for a while is Cognizant Technology Solutions (CTSH); this is a stock whose long-term trend contradicts the broader sector pattern, as the stock is down a little over -15% since reaching an all-time high around $85 in March of 2018. It rallied briefly to begin 2019 before dropping back to a low in May of this year around $57. From that point, the stock has followed a mostly sideways pattern, marking a consolidation pattern against the longer-term downward trend that could bode well for the near-term.
One of the reasons for CTSH’s downward trend is that, against the backdrop of increased costs from tariff pressures globally, companies in just about every segment of the economy have been reluctant to allocate new capital to professional services such as what CTSH provides, particularly in the Financial Services and Healthcare segments. Against that weakness, however its services are deeply tied into data and analytics, which provides a strong base to build the rest of its business from. Global IT spending is expected to increase in 2020, which means this could be a useful opportunity now to buy a good company at a nice price.
Fundamental and Value Profile
Cognizant Technology Solutions Corporation is a professional services company. The Company operates through four segments: Financial Services, Healthcare, Manufacturing/Retail/Logistics, and Other. The Financial Services segment includes customers providing banking/transaction processing, capital markets and insurance services. The Healthcare segment includes healthcare providers and payers, as well as life sciences customers, including pharmaceutical, biotech and medical device companies. The Manufacturing/Retail/Logistics segment includes manufacturers, retailers, travel and other hospitality customers, as well as customers providing logistics services. The Other segment includes its information, media and entertainment services, communications and high technology operating segments. Its services include consulting and technology services and outsourcing services. Its outsourcing services include application maintenance, IT infrastructure services and business process services. CTSH has a current market cap of $33.9 billion.
Earnings and Sales Growth: Over the last twelve months, earnings decreased by -1.82%, while sales increased by about 4%. In the last quarter, earnings improved by almost 15% while Revenues increased about 2.5%. The negative earnings pattern over the last year, with a turn to positive in the last quarter, is a good indication of a turnaround in an area that has been one of the primary reasons for the stock’s underperformance over the last year. CTSH’s Net Income versus Revenue is healthy and appears to confirm the turnaround, running at 12.6% over the last twelve months and 11.7% in the last quarter.
Free Cash Flow: CTSH’s Free Cash Flow is healthy, at about $1.6 billion. That translates to a Free Cash Flow Yield of 5.42%.
Debt to Equity: CTSH has a debt/equity ratio of .13, which is a good reflection of the company’s conservative approach to leverage. Their balance sheet shows about $3 billion in cash and liquid assets against about $1.44 billion in long-term debt. These are strongly positive indicators that give the company excellent liquidity and financial flexibility to adapt to ongoing changes in the markets it operates in.
Dividend: CTSH pays an annual dividend of $.80 per share, which at its current price translates to a dividend yield of about 1.29%. That is modest, but it is also much less than 50% of the stock’s earnings per share over the last twelve months – a conservative payout ratio that actually helps bolster the company’s balance sheet strength.
Price/Book Ratio: there are a lot of ways to measure how much a stock should be worth; but one of the simplest methods that I like uses the stock’s Book Value, which for CTSH is $19.46 per share. At the stock’s current price, that translates to a Price/Book Ratio of 3.17 against a historical average of 3.79, which puts the stock’s “fair” value at almost $74 per share. That’s about 19% away from the stock’s current price, which is pretty good; however the stock is also trading about 34% below its historical Price/Cash Flow ratio, which offers a top-end, long-term target price a little above $91 per share – which is very attractive.
Technical Profile
Here’s a look at the stock’s latest technical chart.
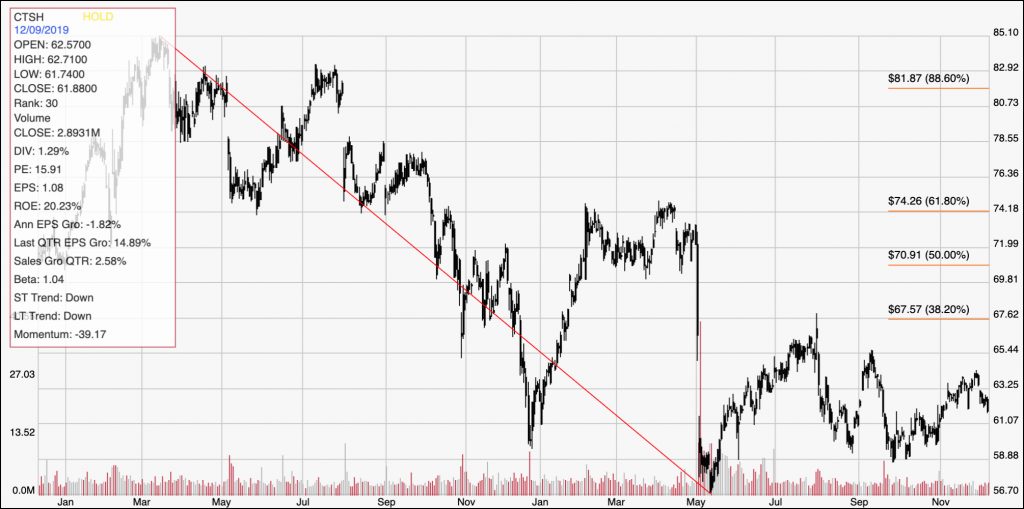
Current Price Action/Trends and Pivots: The chart above covers the last two years of price activity; the diagonal red line traces the stock’s downward trend from its March 2018 peak to its May low around $57. Since September, the stock has defined a sideways, consolidation pattern, with resistance around $64 and support at about $59. The stock is currently retracing off of a high point around $64 and is about in the middle of that range. A break above $64 could give the stock room to run to about $67.50 where the 38.2% Fibonacci retracement line sits. A drop below $59 could see the stock drop to around $56 and establish a new two-year low.
Near-term Keys: The stock’s fundamentals are strong, and the bargain proposition is very appealing; however it is worth noting that industry analysts right now are forecasting stagnant to tepid growth in revenues and profits for the company for the next year or so, which means that while the stock looks attractive from a valuation standpoint, a push back near to its all-time highs is likely to be an extended, very long-term prospect. If you prefer to work with shorter-term trading strategies, you could use a break above the stock’s immediate resistance at about $64 as a signal to buy the stock or work with call options, with a near-term exit target at around $67.50. There could also be a bearish opportunity, although you’d have to wait to see the stock push below $59 to see a good signal for a bearish opportunity to short the stock or to buy put options. In that case, the exit target would be around $56 per share, and if the bearish momentum persists, you may be able to extend that trade to around $51.