Over the last couple of weeks, trade concerns have, not surprisingly, taken center stage in the marketplace all over again. Most other indications – jobs and wage growth, interest rate policy – continue to point to the prospect of a stable, manageable economy for the time being, and even the foreseeable future. That means that if there is any one thing that is going to be able to tip the scales enough to finally end the economy’s longest period of growth, it continues to be the relationship between the U.S. and its trade partners.
The truth is that I don’t think the dance between the U.S. and China is going to start following a different beat before the end of the year; there is so much posturing between the two countries that it is creating enough speculation and uncertainty to keep the market on edge until clearer signs of progress or regression on tariffs are seen. I know that it sounds like a tired tune after almost two years of tariffs and trade pressures, not only with China but also practically all of America’s most important trade partners; but perhaps that is the reason that it’s always a good idea to try to pay attention to stocks that could offer a defensive means of diversification.
Utility stocks are generally accepted as some of the most conservative stocks to work with when economic uncertainty, and the fear of a downturn or even recession starts to increase. That means that stocks like Southern Co. (SO) start to look a lot more attractive the more likely a major reversal appears to be. From a value-based perspective, SO might be overvalued; after all, the stock is up about 41% over the last year, rising from a December 2018 low around $42.50 to its current price above $60 per share. Even so, this a utility company with a solid, stable fundamental profile, healthy cash flow and a strong dividend offering a useful passive income. Does that mean you should use the stock to keep your money working for you? Let’s run the numbers so you can decide for yourself.
Fundamental and Value Profile
The Southern Company (Southern Company) is a holding company. The Company owns all of the stock of the traditional electric operating companies and the parent entities of Southern Power Company (Southern Power) and Southern Company Gas, and owns other direct and indirect subsidiaries. The Company’s segments include Gas distribution operations, Gas marketing services, Wholesale gas services, Gas midstream operations and All other. The Gas distribution operations segment includes natural gas local distribution utilities that construct, manage, and maintain intrastate natural gas pipelines and gas distribution facilities in seven states. The Gas marketing services segment provides natural gas commodity and related services to customers markets that provide for customer choice. The Wholesale gas services segment engages in natural gas storage and gas pipeline arbitrage. The Gas midstream operations consist primarily of gas pipeline investments, with storage and fuels. SO’s current market cap is about $63.6 billion.
Earnings and Sales Growth: Over the last twelve months, earnings increased more than 17.5%, while sales decreased by -2.66%. In the last quarter, earnings improved by 67.50% while revenues improved by 17.6%. SO operates with a strong, stable operating profile; over the last twelve months Net Income was 21% of Revenues and 22% in the last quarter.
Free Cash Flow: SO’s free cash flow is healthy, at a little more than $3.8 billion. That translates to a useful Free Cash Flow Yield of about 5.88%. It is also worth noting that SO’s Free Cash Flow was about $6 billion in June of this year.
Debt to Equity: SO has a debt/equity ratio of 1.37. That’s a high number that is a good indication of SO’s high leverage. Their balance sheet in the last quarter shows $2.9 billion in cash and liquid assets versus $43.7 billion in long-term debt.
Dividend: SO pays a dividend of $2.48 per share, which translates to an annual yield of about 4.09% at the stock’s current price.
Price/Book Ratio: there are a lot of ways to measure how much a stock should be worth; but one of the simplest methods that I like uses the stock’s Book Value, which for SO is $30.31, and which translates to a Price/Book ratio of 2.0 at the stock’s current price. The stock’s historical average Price/Book ratio is 2.03, which means the stock is fairly valued, sitting only about $1 below its fair value. Using the stock Price/Cash Flow ratio provides a somewhat different view; SO is trading more than 20% above its historical average, which puts the stock’s fair price at just about $48.50.
Technical Profile
Here’s a look at the stock’s latest technical chart.
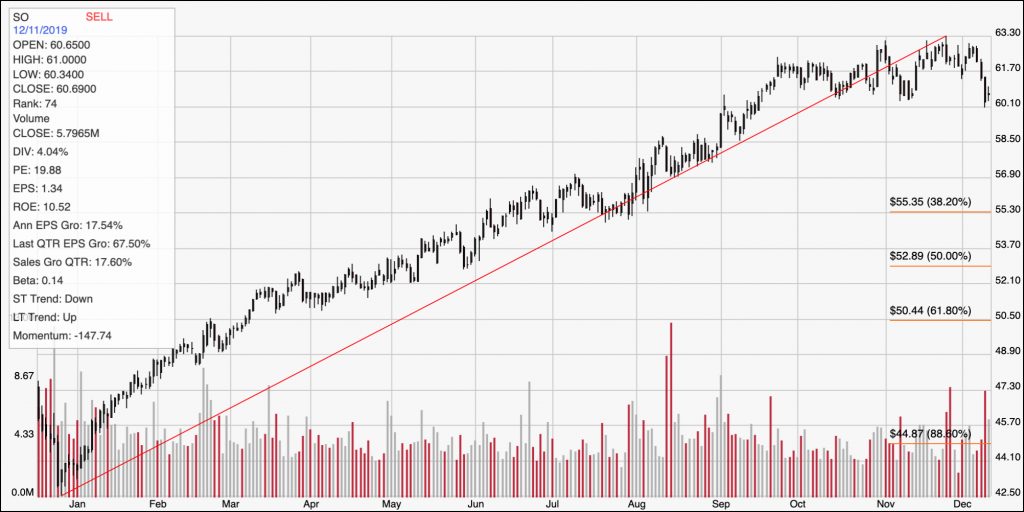
Current Price Action/Trends and Pivots: The diagonal red line traces the stock’s upward trend from the end of 2018 to its peak at about $63.30 at the end of November. It also provides the baseline used to calculate the Fibonacci retracement lines shown on the right side of the chart. The stock is about -3% below that high, with current momentum clearly on the bearish side. Immediate support is around $60.50 based on a swing low point in early November; if it drops below that point, it could drop to about $58.50, with further downside around $55.35, which is where the 38.2% retracement line rests. A push above resistance, at the stock’s all-time high at $63.30 would mark a new all-time high; using the difference between current support and resistance, that would put a new short-term peak at around $66.50 per share.
Near-term Keys: SO is a stock with a solid fundamental profile, but at its current price there really isn’t any way to think of the stock as a good value. That doesn’t automatically mean there is a lot of downside risk, either; but I do think the stock’s phenomenal price performance over the last year is unlikely to repeat itself in the year ahead. I think this is a stock that could fit into a diversified portfolio as a conservative holding place that will pay a useful, attractive dividend well in access of the S&P 500 average dividend, and above the yields of most conservative debt instruments. Short-term traders might use a drop below $60.50 as a signal to short the stock or work with put options with an eye on a near-term exit at around $58.50, or a push above $63 as a signal to buy the stock or work with call options, with an exit price at around $66.