This morning, news broke, first from the Chinese, but then shortly afterward confirmed by a Trump tweet, that a Phase One deal had been reached between the two countries. The immediate boon for investors is the fact that because the agreement was reached, tariffs that were set to be imposed in two days, on December 15, will not take place. Additional details about the other elements of the deal will certainly be forthcoming, but in the meantime, this looks like “the thing” the market has been waiting for.
The expectation of a trade deal is something that has been boosting the market since mid-September, and it doesn’t seem unreasonable given this new set of information to suggest that the market has room to move higher for foreseeable future. This is something that I think is going to be a catalyst on a broad level, including on the energy sector.
2019 has been an interesting year for energy. Global trade tensions drove crude prices from multiyear highs in both Brent and West Texas light sweet crude almost 50% lower by the end of 2018. From that point, crude rallied back nearly 50% again by the end of April. West Texas Intermediate (WTI) crude, for example, surged from about $43 per barrel to about $66 over that period before trade fears had their way all over again, driving prices throughout the financial markets lower over the course of the month of May. WTI crude found a new low by the beginning of June around $52, and from that point had been hovering somewhere between $52 and $56. In the last few weeks, WTI has broken above that level and is currently testing $60 per barrel. Trade hasn’t been the only catalyst – the re-imposition by the U.S. of sanctions on Iran, along with the alleged retaliatory attack by Iran on U.S. military assets in the Strait of Hormuz put investors back on edge.
Moving into the end of the year and into 2020, another element that I think is interesting is the difference (also called the spread) in price between similar commodities, like Brent crude versus WTI crude. The U.S. actually imports more oil from outside the U.S. than it uses its own supply, which means that changes in the spread can also have a direct impact on those finished goods.
Oil refining is an industry where that spread makes a big difference in the ability of U.S. refineries to be profitable. A wider spread usually works in favor, since they can get U.S. crude at a bigger discount than they can from overseas. In 2016 when both commodities bottomed, that spread was practically zero, which was one of the dynamics that challenged refinery stocks. The spread started to widen in mid-2017, however and had been running between $8 to $10 per barrel pretty consistently until the beginning of June, when the spread started to narrow. As of this writing, the spread has narrowed even more, to a little less than $5 per barrel. That’s not good news right now for refiners, including the biggest players like Marathon Petroleum Corp (MPC), who actively use both Brent and WTI crude to differing extents. MPC’s stock saw a strong rally of about 50% from September to the end of October, but has dropped back about -15% from that point. Does that mean the stock offers a useful, new value-based opportunity? Let’s find out.
Fundamental and Value Profile
Marathon Petroleum Corporation is engaged in refining, marketing, retail and transportation businesses in the United States and the largest east of the Mississippi. The Company operates through three segments: Refining & Marketing; Speedway; and Midstream. The Refining & Marketing segment refines crude oil and other feedstocks at the Company’s seven refineries in the Gulf Coast and Midwest regions of the United States. Its Speedway segment sells transportation fuels and convenience products in the retail market in the Midwest, East Coast and Southeast regions of the United States. The Company’s Midstream is engaged in the operations of MPLX LP and certain other related operations. It gathers, processes and transports natural gas, natural gas liquids (NGLs), crude oil and refined products. MPLX is a limited partnership which owns, operates, develops and acquires midstream energy infrastructure assets. MPC has a current market cap of about $38.8 billion.
Earnings and Sales Growth: Over the last twelve months, earnings decreased by -4.12%, while revenues grew by almost 35%. The the last quarter, earnings declined almost -6% while sales dropped about -7.4%. While those numbers are negative, they are also significantly improved over the numbers reported during the last summer. The company’s margin profile is very narrow, but improving, with Net Income as a percentage of Revenues over the last twelve months at 2.49% and 3.52% in the last quarter.
Free Cash Flow: MPC’s free cash flow is healthy and improving at $4.75 billion over the last twelve months; it was about $2.6 billion in March of this year. That translates to a Free Cash Flow Yield of 12.6%. That also marks an improvement from $1.4 billion in the first quarter of 2018.
Debt to Equity: MPC’s debt to equity is .71, which is generally considered a conservative number. The company’s balance sheet indicates operating profits should be adequate to service their debt, and it also indicates the company’s liquidity is improving – about $1.5 billion in cash and liquid assets in the last quarter compared to $877 million in June of this year. Long-term debt, however is increasing, at a little over $30 billion in the last quarter versus $18.4 billion in the last quarter of 2018. At least a portion of the increase can be explained by MPC’s acquisition in October of last year of competitor Andeavor for $23 billion in cash and stock.
Dividend: MPC’s annual divided is $2.12 per share, which translates to a yield of about 3.59% at the stock’s current price.
Price/Book Ratio: there are a lot of ways to measure how much a stock should be worth; but one of the simplest methods that I like uses the stock’s Book Value, which for MPC is $64.79. That means that the stock’s Price/Book ratio is .91. Their historical Price/Book ratio is 2.33, which suggests that the stock is undervalued by more than 100% right now. By contrast, however the stock is actually trading about just about 2.2% above its historical Price/Cash Flow ratio.
Technical Profile
Here’s a look at the stock’s latest technical chart.
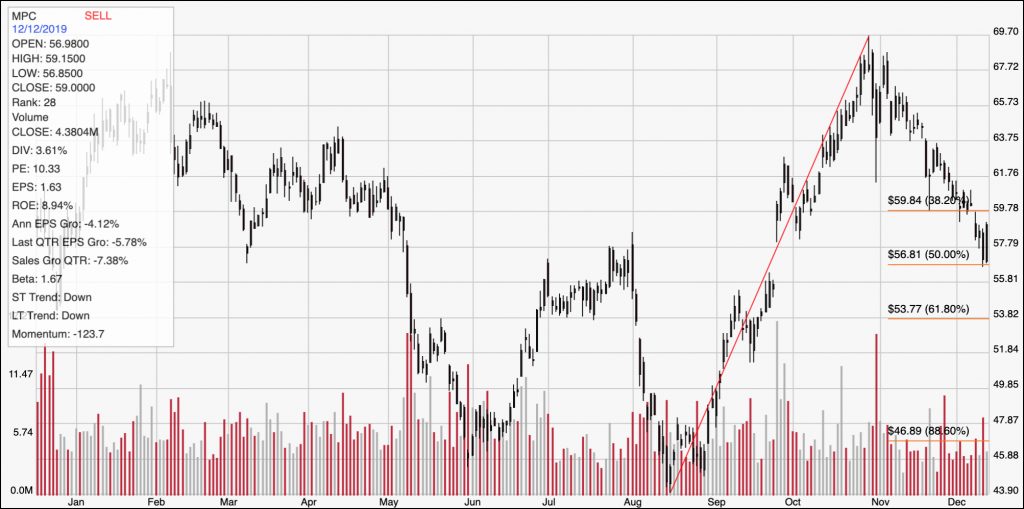
Current Price Action/Trends and Pivots: The chart above covers the last year of price activity. The red diagonal line traces the stock’s upward trend beginning in mid-August to its Halloween peak at a little below $70. That line also informs the Fibonacci retracement lines shown on the right side of the chart. The stock has dropped back from that point and recently tested the 50% retracement line at around $57 per share. That is the current support level for the stock, with a drop below that point putting the next most likely support at around $54 per share, where the 61.8% retracement line can be seen. If the stock can break and hold above $60, where the 38.2% line is seen, the stock could rally to about $64 pretty easily; that level comes from an April pivot high that the stock dropped straight below during the latest downturn.
Near-term Keys: If you work off of the basis of the stock’s Price/Book ratio, MPC carries a compelling value argument. Projecting a long-term target price above $145 per share is over-optimistic in my view, given that the stock’s all-time high was reached in September of last year at just about $88; however that peak does offer an interesting opportunity if you’re willing to be patient with a stock that has a solid and improving fundamental basis. From a short-term standpoint, a break above $60 could offer an interesting short-term bullish trade using the stock itself or call options, with a short-term target at around $64 per share. A push below $57 should see the stock drop to about $54, with room to test its 52-week low point around $45 if bearish momentum continues; that could offer a useful opportunity to short the stock or to buy put options.