Since the end of April, it hasn’t been all that unusual to see stocks down -10% or more. Since both the Trump administration and Chinese officials have announced agreement on phase one of a trade agreement last week, however, the market is pushing to a new set of all-time highs – something that should give a boost to stocks already near or at all-time highs. Stocks that underperform and differ from the broad market’s pattern are called losers and generally dismissed by most analysts and investors; but the truth is that is also where some of the best long-term opportunities are to be found. That is also more likely to be true if the “loser” you’re looking at has a strong fundamental profile to counter its decline.
The Mosaic Company (MOS) is a company in the Materials sector I’ve followed for some time that has underperformed the market, but has also had a generally solid fundamental profile. As a fertilizer and animal feed producer, it operates in a highly cyclical industry. Since November, the stock is down a little over -40%, and -15% in just the last month, putting it clearly into that “loser” category I just mentioned. The extended health of the economy in general suggests that MOS’ cost of goods is higher than normal; whether that is a sign the company’s fortunes are about to reverse remains to be seen. In the last few months, unfavorable weather, along with trade pressures have put a lot of stress on the company’s fortunes, leading to a deterioration of many of my favorite measurements. The value proposition for the stock looks more attractive than ever; but how do you tell a useful, undervalued opportunity from just another cheap stock – a value trap? Let’s dive in and find out.
Fundamental and Value Profile
The Mosaic Company is a producer and marketer of concentrated phosphate and potash crop nutrients. The Company operates through three segments: Phosphates, Potash and International Distribution. The Company is a supplier of phosphate- and potash-based crop nutrients and animal feed ingredients. The Phosphates segment owns and operates mines and production facilities in Florida, which produce concentrated phosphate crop nutrients and phosphate-based animal feed ingredients, and processing plants in Louisiana, which produce concentrated phosphate crop nutrients. The Potash segment mines and processes potash in Canada and the United States, and sells potash in North America and internationally. The International Distribution segment markets phosphate-, potash- and nitrogen-based crop nutrients and animal feed ingredients, and provides other ancillary services to wholesalers, cooperatives, independent retailers and farmers in South America and the Asia-Pacific regions. MOS has a current market cap of about $7.5 billion.
Earnings and Sales Growth: Over the last twelve months, earnings declined -89%, while revenues declined by nearly -6%. In the last quarter, earnings dropped by -33.33%, while sales improved almost 26.5%. The company’s margin profile is negative, and shows serious deterioration; Net Income as a percentage of Revenues declined from -0.36% over the last twelve months to -1.6% in the last quarter.
Free Cash Flow: Like Net Income MOS’s free cash flow is is also negative, at -$249 million. Earlier this year, Free Cash Flow was around $277 million, but this turn to negative territory is confirmation of much longer, troubling trend; Free Cash Flow has declined steady for more than a year from the company’s Free Cash Flow peak, which was a little over $1 billion in the 3rd quarter of 2018.
Debt to Equity: MOS has a debt/equity ratio of .44. This is a conservative number. MOS currently has a little over $641.1 million in cash and liquid assets against about $4.5 billion in long-term debt. The company’s balance sheet indicates their operating profits cannot service the debt they have, which means that cash, which has also declined from about $1 billion in the 3rd quarter of 2018 to its current level, must be used to do it. If the negative pattern of Net Income and Free Cash Flow don’t reverse in the next quarter or two, there could be more trouble ahead.
Dividend: MOS’s annual divided is minimal, at only $.20 per share; that translates to a yield of just 1.03% at the stock’s current price.
Price/Book Ratio: there are a lot of ways to measure how much a stock should be worth; but one of the simplest methods that I like uses the stock’s Book Value, which for MOS is $27.13 and translates to a Price/Book ratio of .72 at the stock’s current price. Their historical average Price/Book ratio is 1.11, suggesting suggests the stock is currently trading at a discount of almost 55%. The stock’s Price/Cash Flow ratio provides an even more optimistic view, since the stock is currently sitting 94% below its historical average. Both are admittedly interesting; but given the fundamental weakness in Net Income, Free Cash Flow and debt, I don’t think this is a stock that can be considered a good value any longer.
Technical Profile
Here’s a look at the stock’s latest technical chart.
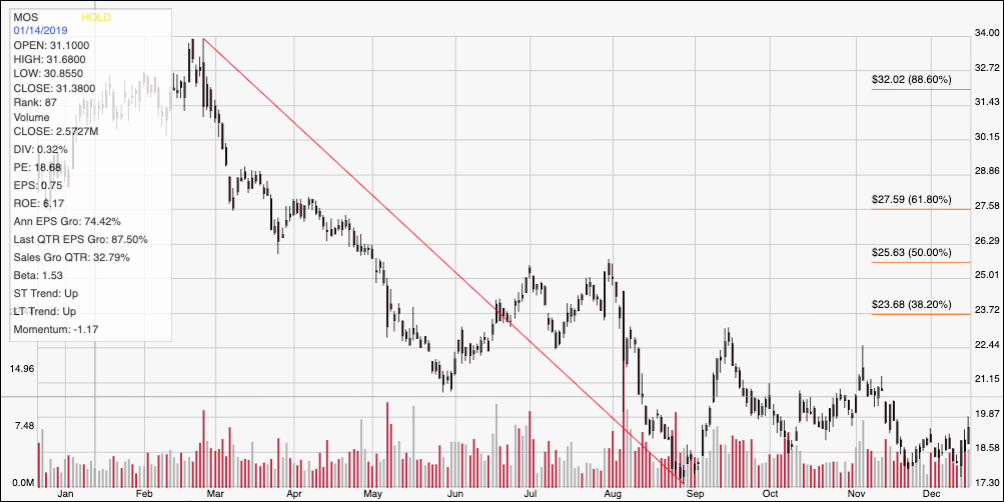
Current Price Action/Trends and Pivots: The red line on the chart above outlines the stock’s downward trend from November of last year to August of this year; it also informs the Fibonacci retracement levels on the right side of the chart. The stock has significant bearish momentum right now, having broken through its most recent support level around $23. Its next closest support is around $20 from pivot levels last seen in the fourth quarter of 2017. The stock has held since that August low in a tightening consolidation range, with current resistance sitting at around $20 per share. A break above that point could see the stock rally to about $21.
Near-term Keys: Trying to find a short-term bullish trade in this stock is pretty hard right now, and frankly would fall on the side of extreme speculation. Considering the size of the stock’s decline to its current levels and consolidation range since August, it’s also hard to suggest a short-term bearish trade of any kind, since the stock is already plumbing the lower extremes of its historical trading ranges; it’s a bit like trying to scrape the bottom of an empty barrel for water. I would wait for the earnings report or two to see if the company can show signs of stabilizing Net Income; that would likely be the first sign of a fundamental improvement, which could make it easier to find a useful opportunity to work with this stock.