The commentary lately has seemed to start shifting strongly back to the bullish side of things – trade progress between the U.S. and China, an extension of the European Union’s deadline for Brexit to the end of January of next year, central banks in the U.S. and across the globe that all seem intent on remaining accommodative for the foreseeable future – it isn’t surprising under the circumstances that investors seem inclined to shrug aside the perception of risk.
While these conditions might make DUKt investors inclined to be less conservative, I’m a little wary; I think that given the already extended state of the market’s long-term upward trend, which is entering its eleventh year means that there is an increasing risk of a “melt-up” – a term that analysts like to use to describe the bullish rallies that often mark the latest stages of a long-term trend. That means that, contrary to common perception, downside risk might actually be increasing, and that’s why I think it’s still smart to be cautious, even conservative.
In uncertain economic conditions, one of the areas of the market that investors usually start to look at as a “safe haven” is the Utilities sector. Utilities companies generally have stable cash flows, even when economies turn bearish. Many of these companies, including Duke Energy Corp (DUK), pay healthy dividends as well, which adds the advantage of useful, passive income generation to go along with their stable fundamental profile. Those are among the reasons that the entire sector has performed strongly this year; DUK itself rallied 18% higher from January of this year early October before dropping back about 12% in late November. From that point, the stock has rebounded again by about 5%, which could be setting up a new opportunity to buy an interesting, conservative stock at the early stages of a new bullish trend. But is it still a good value as well? Let’s find out.
Fundamental and Value Profile
Duke Energy Corporation (Duke Energy) is an energy company. The Company operates through three segments: Electric Utilities and Infrastructure; Gas Utilities and Infrastructure, and Commercial Renewables. The Company operates in the United States through its direct and indirect subsidiaries. The Electric Utilities and Infrastructure segment provides retail electric service through the generation, transmission, distribution and sale of electricity to approximately 7.5 million customers within the Southeast and Midwest regions of the United States. The operations include electricity sold wholesale to municipalities, electric cooperative utilities and other load-serving entities. The Gas Utilities and Infrastructure segment serves residential, commercial, industrial and power generation natural gas customers. The Commercial Renewables primarily acquires, builds, develops and operates wind and solar renewable generation throughout the continental United States. DUK has a current market cap of about $66 billion.
Earnings and Sales Growth: Over the last twelve months, earnings increased 8.5%, while revenues improved by about 4.7%. In the last quarter, earnings increased even more, by 60%, while sales improved a little more than 18%. The company’s margin profile is strong, and improving; Net Income as a percentage of Revenues strengthened from 14.1% over the last twelve months to 19.33% in the last quarter.
Free Cash Flow: DUK’s free cash flow is actually negative, at -$3.56 million. This is a glaring red mark against the stock’s mostly bullish profile; the last quarter this measurement was positive was the third quarter of 2015.
Debt to Equity: DUK has a debt/equity ratio of 1.24. This is a high number that is a strong indication of the stock’s highly leveraged status. DUK currently has a little over $379 million in cash and liquid assets against more than $56 billion in long-term debt. The company’s balance sheet indicates their operating profits are strong enough to service the debt they have, but also that if there is any downturn in that profile, cash is inadequate to cover the company’s short-term needs.
Dividend: DUK’s annual divided is minimal, at only $3.78 per share; that translates to a yield of just 4.17% at the stock’s current price.
Price/Book Ratio: there are a lot of ways to measure how much a stock should be worth; but one of the simplest methods that I like uses the stock’s Book Value, which for DUK is $62.37 and translates to a Price/Book ratio of 1.45 at the stock’s current price. Their historical average Price/Book ratio is 1.37, which suggests the stock is currently overvalued by about -5.36%.
Technical Profile
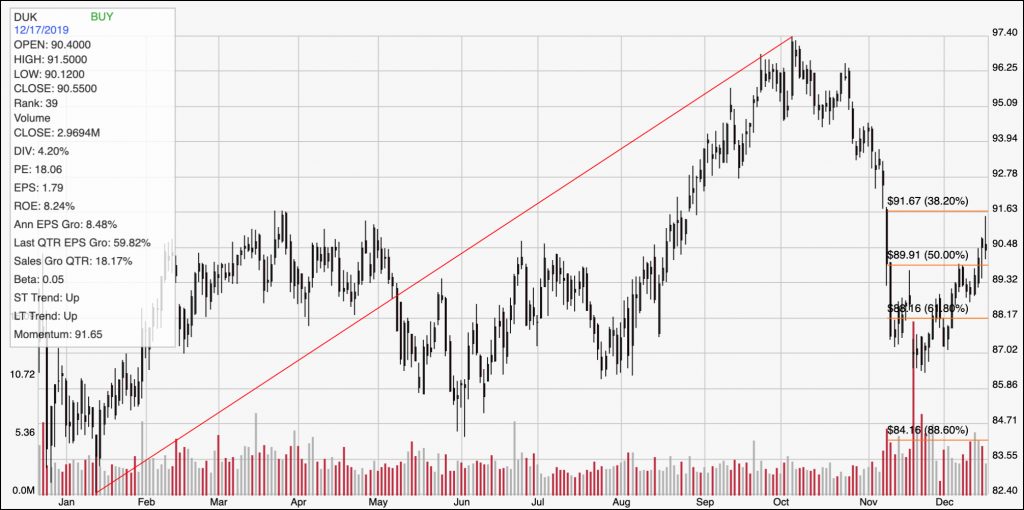
Here’s a look at the stock’s latest technical chart.

Current Price Action/Trends and Pivots: The red line on the chart above outlines the stock’s upward trend from January of last year to September of this year; it also informs the Fibonacci retracement levels on the right side of the chart. Over the last month, the stock has rebounded from a short-term downward trend to start a new, upward trend. Current resistance is around $92 based on the 38.2% Fibonacci retracement line. Support is around $90, at the 50% retracement line. A break above $92 could see the stock rally to as high as about $95 per share, while a drop below $90 could see about $3 of downside, to the last pivot low in late November around $87.
Near-term Keys: The stock’s current bullish momentum lends a strong idea to looking for a bullish short-term trade; a break above $92 could be taken as a good signal to buy the stock or to work with call options. A drop below $90, on the other hand would act as a good signal to think about shorting the stock or working with put options. While either case could offer an interesting short-term trade, the company’s value proposition, and extreme weakness in Free Cash Flow mean that I don’t think using DUK for a long-term, value-based investment.