No matter what current market conditions are at any given time, the point of value-oriented investing is to find stocks that offer attractive long-term upside. For my approach, that means using a combination of valuation, fundamental strength, and technical analysis to filter through the thousands of stocks that are available.
With market enthusiasm set to push the market back to a new set of all-time highs – what some analysts are referring to right now as a fresh new “melt-up” – it’s tempting to use that momentum and keep working with stocks that are already at or near all-time highs. That runs the risk of sitting in a stock, however that is already overvalued, at the top of a bull market that a melt-up often marks the end of that run.
My approach to value analysis puts a big emphasis on stocks that are currently sitting at or near historical lows. In a bull market, these are stocks that have diverged from the rest of the market, and so most investors tend to shy away from these kinds of stocks. That’s why value investing can sometimes be a bit of a contrarian approach, especially at the long end of a bull market.
International Paper Company (IP) is a good example of the kind of emerging opportunity that value investing sometimes offers. The stock has been following a downward trend that began in late January of 2018 and didn’t find a bottom until the end of August. From that point, the stock has rallied, moving about 28% higher from that point. Over the last couple of weeks, however, the stock appears to have started to consolidate at the top of its short-term upward trend. That could offer an interesting opportunity to buy into a stock that is still more than 30% below its multiyear high at around $67. How does the stock’s fundamental and value profile stack up? Let’s find out.
Fundamental and Value Profile
International Paper Company is a paper and packaging company with primary markets and manufacturing operations in North America, Europe, Latin America, Russia, Asia, Africa and the Middle East. The Company operates through it four segments: Industrial Packaging, Global Cellulose Fibers, Printing Papers and Consumer Packaging. The Company is a manufacturer of containerboard in the United States. Its products include linerboard, medium, whitetop, recycled linerboard, recycled medium and saturating kraft. The Company’s cellulose fibers product portfolio includes fluff, market and specialty pulps. The Company is a producer of printing and writing papers. The products in Printing Papers segment include uncoated papers. IP has a current market cap of about $18.2 billion.
Earnings and Sales Growth: Over the last twelve months, earnings declined -30%, while revenues dropped by about -5.64%. In the last quarter, earnings were -5.22% lower, while sales dropped by -1.75%. The company’s margin profile is solid, and stable; Net Income as a percentage of Revenues was 6.08% over the last twelve months and 6.17% in the last quarter.
Free Cash Flow: IP’s free cash flow is strong, and getting stronger, at $2.33 billion. This also marks an improvement from $1.67 billion in the last year.
Debt to Equity: IP has a debt/equity ratio of 1.37. This is a high number that is a strong indication of the stock’s highly leveraged status. IP currently has a little over $697 million in cash and liquid assets against about $10.2 billion in long-term debt. The company’s balance sheet indicates their operating profits are strong enough to service the debt they have; however short-term liquidity is a red flag.
Dividend: IP’s annual divided is minimal, at only $2.05 per share; that translates to a very attractive yield of just 4.43% at the stock’s current price.
Price/Book Ratio: there are a lot of ways to measure how much a stock should be worth; but one of the simplest methods that I like uses the stock’s Book Value, which for IP is $19.01 and translates to a Price/Book ratio of 2.43 at the stock’s current price. Their historical average Price/Book ratio is 3.84, which suggests the stock is undervalued by more than 57.8%. In addition, the stock’s Price/Cash Flow ratio is 62% below its historical average. Together, these two metrics puts the stock’s long-term target price between $72 and $75 per share.
Technical Profile
Here’s a look at the stock’s latest technical chart.
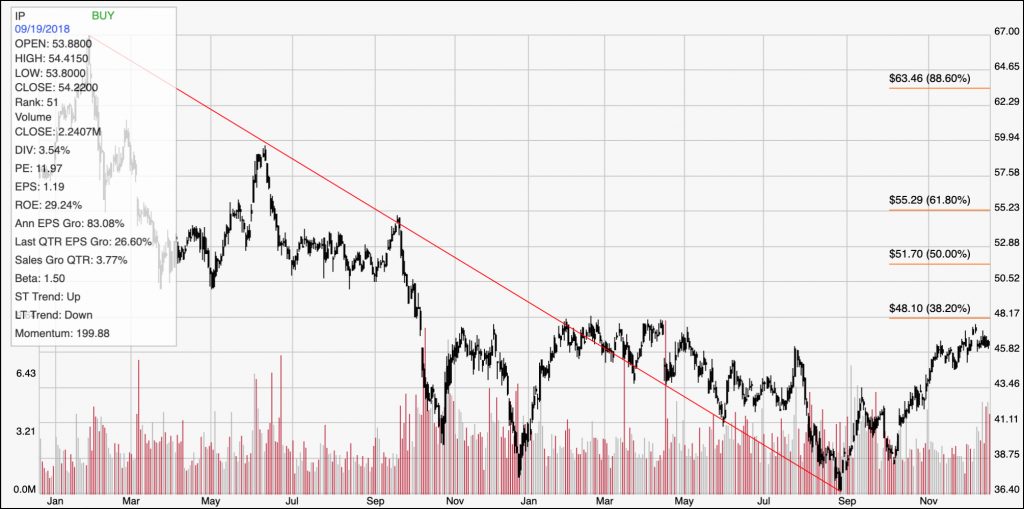
Current Price Action/Trends and Pivots: The red line on the chart above outlines the stock’s downward trend from January of 2018 to September of this year; it also informs the Fibonacci retracement levels on the right side of the chart. Since September, the stock has rebounded strongly to launch a new short-term upward trend with a recent peak at around $47. Current resistance is a little below $46, with the next support level if the stock drops back against its short-term trend at around $43.50. Current resistance is between the stock’s recent peak around $47 and $48, where the 38.2% Fibonacci retracement line sits. A push above $48 should give the stock room to rally to about $52, where the 50% retracement can be seen.
Near-term Keys: The stock’s current bullish momentum lends a strong idea to looking for a bullish short-term trade; a break above $48 could be taken as a good signal to buy the stock or to work with call options with an eye on $52 as a short-term profit target. A drop below $46, on the other hand would act as a good signal to think about shorting the stock or working with put options. While either case could offer an interesting short-term trade, the company’s value proposition and overall fundamental strength offer the most compelling argument for the stock, which I think offers an excellent long-term opportunity.