This last week, the only news that talking heads seemed to want to focus on was the impeachment of President Trump by a Democrat-controlled Congress. From a market and economic standpoint, however, that really wasn’t the biggest news. It came from trade, but not from continuing negotiations between the U.S. and China; even as it impeached Donald Trump, Congress also passed the U.S.-Mexico-Canada Trade Agreement (USMCA), negotiated by the Trump administration to replace NAFTA.
The deal stands to benefit the U.S. in a number of ways and several different segments of the economy, including agriculture and autos. That includes automotive component manufacturers like Magna International (MGA), whose three biggest customers are General Motors (GM), Ford (F), and Fiat Chrysler (FCAU). The trade deal paves the way for companies like MGA, who is based in Canada, to provide their goods and services with reduced tariffs or, under certain conditions, entirely tariff-free. That should help improve the bottom line for these companies, which provides an improved long-term outlook for investors.
Since hitting a downward trend low in June of this year a little below $31, MGA has rebounded more than 50% to date; but with renewed optimism coming from trade peace, sentiment certainly seems to be on the side of the entire auto industry. If that’s true, there could be even more upside ahead. The question for value investors, of course is whether the stock’s fundamental strength and valuation provide a basis to support the current market sentiment about the industry. Let’s dig in to the numbers and find out.
Fundamental and Value Profile
Magna International Inc. (Magna) is a global automotive supplier. The Company’s segments are North America, Europe, Asia, Rest of World, and Corporate and Other. The Company’s product capabilities include producing body, chassis, exterior, seating, powertrain, electronic, active driver assistance, vision, closure, and roof systems and modules, as well as vehicle engineering and contract manufacturing. The Company has over 320 manufacturing operations and approximately 100 product development, engineering and sales centers in over 30 countries. It provides a range of body, chassis and engineering solutions to its original equipment manufacturer (OEM) customers. It has capabilities in powertrain design, development, testing and manufacturing. It offers bumper fascia systems, exterior trim and modular systems. It offers exterior and interior mirror systems. It offers sealing, trim, engineered glass and module systems. It offers softtops, retractable hardtops, modular tops and hardtops. MGA has a current market cap of about $17.1 billion.
Earnings and Sales Growth: Over the last twelve months, earnings declined about -9.6%; Revenues also dropped -3.11%. In the last quarter, earnings dropped by -11.3%, while sales were -5.5% lower. This is also part of a pattern of slowing growth that I attribute to the impact from tariffs on costs, both for MGA as well as for its customers.
Free Cash Flow: MGA’s free cash flow is healthy, at a little more than $2.5 billion. This number has been somewhat cyclic from one quarter to the next, but has shown a general, upward stair-step pattern of growth going back to the last quarter of 2016. It also translates to an attractive Free Cash Flow Yield of 14.6%.
Dividend: MGA pays an annual dividend of $1.46 per share, which translates to an annual yield of 2.51% at the stock’s current price. The company has also increased the dividend from $1.32 per share, per year since late 2018, which is a strong indication of management’s confidence in their business.
Price/Book Ratio: there are a lot of ways to measure how much a stock should be worth; but one of the simplest methods that I like uses the stock’s Book Value, which for MGA is $35.35 and translates to a Price/Book ratio of 1.58 at the stock’s current price. The stock’s historical average Price/Book ratio is 1.84, suggesting the stock is undervalued by about 16%; at par with its average, the stock should be trading at about $65 per share. As a long-term target, that price looks even better when you consider that based on the stock’s Price/Cash Flow ratio, MGA is about 32% below its historical average. That would put the stock in range to test its all-time highs and in position to start making new ones.
Technical Profile
Here’s a look at the stock’s latest technical chart.
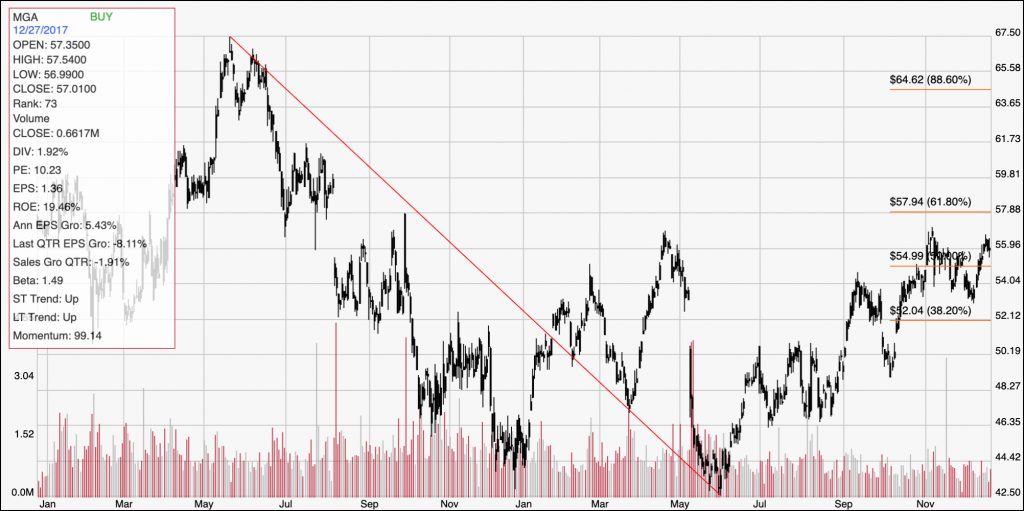
Current Price Action/Trends and Pivots: The chart above provides a good look at the stock’s downward trend from May 2018 to June of this year; the red diagonal line also provides the basis for the Fibonacci retracement lines on the right side of the chart. The stock’s 50% increase from that point saw the stock test a high at around $56 per share at the beginning of November; the stock has consolidated in a range between support at around $53, a little above the 38.2% Fibonacci retracement line and resistance at the $56 high. A push above $56 should see the stock rally to about $58 in the near term before finding new resistance; that level also lines up with the 61.8% retracement line. A drop below $53, however could see the stock find its next support level at around $50.
Near-term Keys: If you’re looking for a short-term bullish trading setup, you can take a break above $56 as a signal with an eye on the 61.8% line, which I expect should act as resistance around $58 per share. A push below $53 would act as a signal to short the stock or consider buying put options with a target around $50. While the stock’s value proposition is appealing, and most of the company’s fundamentals are solid, their negative Net Income over the last quarter is a red flag. It might be wise to wait for at least another quarter or two and watch for an improvement in this critical profitability measurement before considering using MGA for a long-term trade.