One of the hallmarks of the market’s upward trend this year has been the strength of the U.S. economy, even in the face of trade uncertainty that seemed to abate only after the U.S. and China both confirmed an initial, in-principle “phase one” agreement that held off increased tariffs earlier this month, with negotiations ongoing for further rate cuts later in 2020. In addition, by most metrics – healthy employment and improving wages, for example – the economy continues to be healthy.
That reality is reflected in the performance of most market sectors this year as well, including the Consumer Discretionary sector, which is up almost 26.5% year to date as measured by the S&P 500 Consumer Discretionary Sector SPDR ETF (XLY). This is a sector that tends to act as a pretty good barometer for consumer attitudes about the economy. It also covers a wide range of company types, from specialty retailers like Macy’s (M), Target Stores (TGT), Kohl’s Corporation (KSS) to the companies that produce the products and goods that fill those store’s shelves.
Newell Brands Inc. (NWL) is an example of a stock in this sector whose performance not only differs from the sector, but until earlier this year, represented a true fall from grace. From a high in mid-2017 at around $55, the stock plummeted to a low point at around $12.50 per share in August of this year. It has spent most of 2019 in a narrow range between $12.50 and $15. This is a stock with a large footprint in the Household Durables industry, with well-known brands in a portfolio lineup that includes Sharpie and Paper Mate writing utensils, Graco baby products, Rubbermaid, Elmer’s, Mr. Coffee, and much more. Why the poor stock performance? The company has been beset with management problems that eroded the company’s profitability and prompted activist investors with large shareholder positions to push for changes to the company’s board of directors and agitate for a solid turnaround plan.
Those are problems that have been a primary catalyst for the stock’s poor performance, and the truth is that there are some fundamental indicators that are still pretty unattractive. Most of the steps the company has taken, however over the last year to transform their business have been completed and, as of the company’s most recent earnings report, seem to have started to positively impact the company’s bottom line. Does that mean NWL is turning a corner, and could be in the early stages of a major recovery from bargain-basement levels? If it is, you might want to consider taking a position now. Let’s take a look.
Fundamental and Value Profile
Newell Brands Inc. is a marketer of consumer and commercial products. The Company’s segments include Writing, Home Solutions, Commercial Products, Baby & Parenting, Branded Consumables, Consumer Solutions, Outdoor Solutions and Process Solutions. Its products are marketed under a portfolio of brands, including Paper Mate, Sharpie, Dymo, Expo, Parker, Elmer’s, Coleman, Jostens, Marmot, Rawlings, Mr. Coffee, Rubbermaid Commercial Products, Graco, Baby Jogger, NUK, Calphalon, Rubbermaid, Contigo, First Alert, Waddington and Yankee Candle. Writing segment consists of the Writing and Creative Expression business. Home Solutions segment designs, manufactures or sources and distributes a range of consumer products under various brand names. Commercial Products segment designs, manufactures or sources and distributes cleaning and refuse products. Its Baby & Parenting segment designs and distributes infant and juvenile products. NWL has a current market cap of $8.1 billion.
Earnings and Sales Growth: Over the last twelve months, earnings improved 35%, while sales rose almost 7.6%. The pattern also improved in the last quarter, as earnings improved by 62% and sales increased by almost 15.8%. Despite the impressive earnings, the company’s margin profile is a major red flag; in the last twelve months, Net Income as a percentage of Revenues was -5.5% and weakened significantly to more than -25.5% in the last quarter.
Free Cash Flow: NWL has healthy free cash flow of a little over $640.1 million over the last twelve months. This number was just $295 million at the beginning of this year, so this is a good confirmation of the mostly improving fundamentals shown by the earnings and Net Income patterns. Their current Free Cash Flow number translates to a useful Free Cash Flow Yield of 7.86%.
Debt to Equity: the company’s debt to equity ratio is 1.5, which is high and is reflected in the company’s balance sheet. As of the last quarter, cash and liquid assets were $465.4 million versus almost $6.2 billion in long-term debt. NWL is very highly leveraged, and while they should have no problem servicing their debt, liquidity is a concern. It is also worth noting that a year ago, long-term debt was about $9.3 billion, so this number has been declining steadily, which is a net positive and is one of the explanations for the stock’s current, negative Net Income profile.
Dividend: NWL pays an annual dividend of $.92 per share, which translates to a very attractive annual yield of 4.79% at the stock’s current price.
Price/Book Ratio: there are a lot of ways to measure how much a stock should be worth; but one of the simplest methods that I like uses the stock’s Book Value, which for NWL is $9.85 per share. This is a number that cratered from early 2018, when it was a little above $29 per share. At the stock’s current price, that translates to a Price/Book Ratio of 1.94. The stock’s historical Price/Book ratio is 3.2, which provide an interesting long-term target price at around $31.50 per share. That is a level the stock hasn’t seen in the last two years, so it may be a bit over-optimistic; however it does imply the stock’s long-term upside potential is much higher than its downside risk.
Technical Profile
Here’s a look at the stock’s latest technical chart.
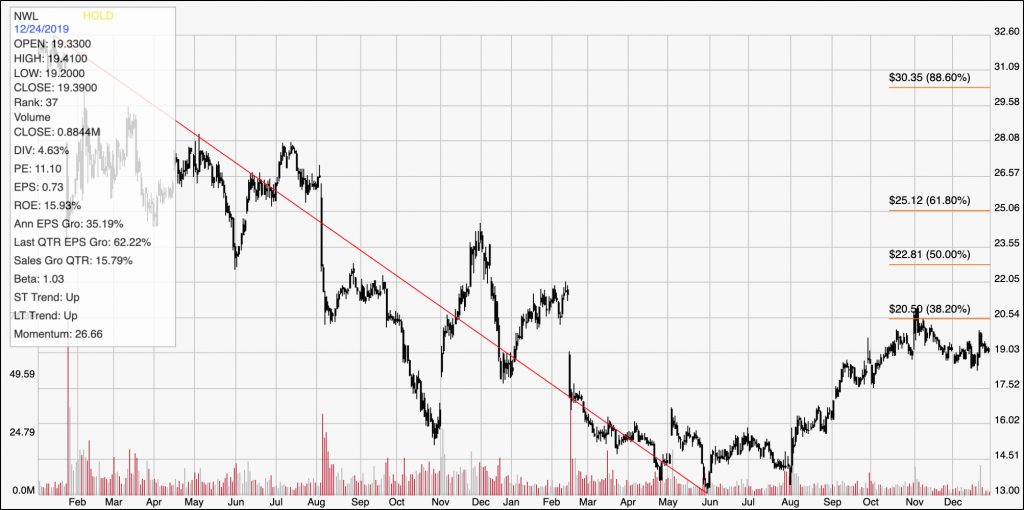
Current Price Action/Trends and Pivots: The diagonal red line traces the stock’s downward trend over the last two years. It also informs the Fibonacci retracement lines shown on the right hand side of the chart. The downward trend is easy to see, but the interesting part is the stock’s upward trend from August to now. The stock peaked at around $20.50 in early November, in line with the 38.2 Fibonacci retracement level. Current support is around $18 per share. A break above $20.50 should give the stock room to rally in the short-term to about $23, a little above the 50% retracement line, while a drop below $18 could see it fall to between $18 and $17.50 based on pivot levels in that area in January and October of this year.
Near-term Keys: The stock’s upward trend since August offers an interesting opportunity to look for a bullish set up; a push above $20.50 would be a good signal to buy the stock or work with call options with an eye on the $23 level in the short-term. A drop below $18, however could act as a strong signal to consider shorting the stock or working with put options. While the stock’s value opportunity is interesting, even compelling, I also think that the company’s negative Net Income pattern is a sign to be patient. I would wait to see this pattern reverse to positive territory on both a quarterly and annualized basis before taking NWL seriously as a long-term, value-based investment.