Over the course of more than two decades as an investor and market analyst, I’ve studied a lot of different books about the markets and talked to a number of fellow investors about their investing methods. I’ve also experimented with as many different investing methods as possible, giving me the experience to compare the different methods against each other and determine what methods work best for my needs, preferences and risk tolerance.
All of my study and experience have ultimately led me to emphasize a similar approach to that used by many of the most successful investors in the markets over the course of the last half century. Value investing is a method that doesn’t get a lot of attention from popular media in most conditions. That’s especially true the longer a bull market lasts, because the increasing perception among average investors and talking heads drives inevitably to growth-oriented strategies, focusing especially on stocks that have been seen making one historical high after another.
Value investing emphasizes stocks that are currently priced at a discount to the value of the underlying company’s business. There are a lot of different ways to analyze what that value actually is; I have learned to combine a stock’s recent price activity with a number of fundamental measurements along with historical valuation metrics. I’ve come to prefer this approach over other methods because I found it to be a useful way to keep finding good, relatively conservative opportunities no matter what the broad market’s current conditions may be.
The risk, of course, is that if the market does turn bearish – the point of reversing to actual bear market, or even recessionary conditions, is that the stock could stay low for an extended period of time. That means that even if you’re looking at a stock that is plumbing extreme historical lows, with terrific fundamentals and a big value proposition, a great deal of patience may be required to justify buying the stock. Franklin Resources Inc. (BEN) is a good example. The stock has been in an extended downward trend over the last five years, dropping from a high around $60 per share in late 2014 to its current price a little above $25. It seems a little odd, given the market’s strongly bullish performance, to see a company that focuses on investment management via a variety of mutual and institutional funds, along with other types of managed account offerings, to see such underwhelming results from the stock; the irony comes from the fact that the longer the bull market lasts, the more average investors gravitate to passive investing vehicles such as index funds rather than actively managed options. If the market reaches a tipping point, that also means that investors are more likely to gravitate to even more conservative, fixed-income alternatives, which could also translate to pressure on BEN’s bottom line. As you’ll see, however, the company has a generally solid fundamental profile, with a strong value proposition. If you are willing to be patient, and work with a long-term perspective, I think there might be a useful valuation proposition to work with.
Fundamental and Value Profile
Franklin Resources, Inc. is a holding company. The Company, along with its subsidiaries, operates as Franklin Templeton Investments. It is a global investment management company that provides investment management and related services to retail, institutional and high net-worth clients in jurisdictions around the world. The Company offers its investment products and services under the Franklin, Templeton, Franklin Mutual Series, Franklin Bissett, Fiduciary Trust, Darby, Balanced Equity Management, K2 and LibertyShares brand names. Its products include investment funds and institutional, high net-worth and separately managed accounts (collectively, sponsored investment products (SIPs)). It offers various types of SIPs, such as the United States funds, cross-border funds, local/regional funds, and other managed accounts, alternative investment products and trusts. Its investment funds include the United States-registered funds, non-United States-registered funds and unregistered funds. BEN has a current market cap of $12.5 billion.
Earnings and Sales Growth: Over the last twelve months, earnings declined by -22.7%, while sales also declined by almost -5%. In the last quarter, earnings continued to decline -6.15%, while revenues declined -1.64%. The company’s margin profile is strong and stable; over the last twelve months as well as the last quarter, Net Income was 21% of Revenues.
Free Cash Flow: BEN’s Free Cash Flow is the only real red flag in the company’s fundamental profile. Over the last twelve months, it stood at -$32.1 million. This is a number that has declined from a little more than $2.1 billion in September of 2018.
Debt to Equity: BEN has a debt/equity ratio of .07, which is a very conservative number. Their balance sheet shows $5.95 billion in cash and liquid assets against just $747.7 million of long-term debt. Their healthy margin profile, along with solid cash position means that they should have no problem servicing their debt right now.
Dividend: BEN pays an annual dividend of $1.08 per share, which translates to a useful dividend yield of about 4.3%.
Price/Book Ratio: there are a lot of ways to measure how much a stock should be worth; but one of the simplest methods that I like uses the stock’s Book Value, which for BEN is $21.09 per share. At the stock’s current price, that translates to a Price/Book Ratio of 1.19. Their historical average is 1.95, which means the stock is significantly undervalued by about 63.5%, and provides a very intriguing reference for the stock’s long-term potential upside, which is at about $41 per share.
Technical Profile
Here’s a look at the stock’s latest technical chart.
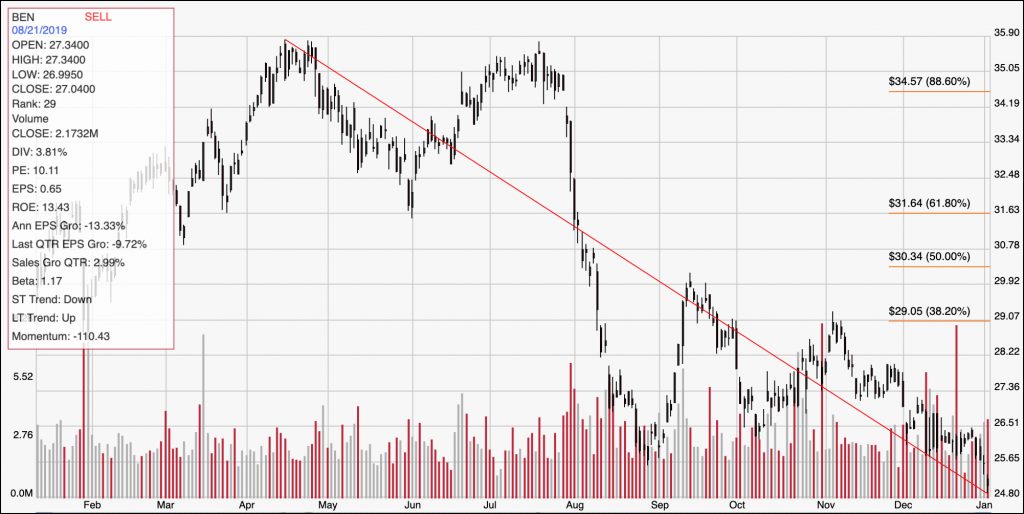
Current Price Action/Trends and Pivots: This chart displays the last two years of stock performance for BEN. The red diagonal line also marks the stock’s downward trend over the last year, and provides the reference for the Fibonacci retracement lines shown on the right side of the chart. The stock is currently increasing in bearish momentum, having recently broken below its 52-week low at around $26 per share. The stock’s next likely support level is around $25.50 per share; this is a level the stock last saw in mid-2009. A break below that level could see the stock test its next low around $21 per share, reached around the same time period. Resistance is between $26 and $26.50 per share; a break above that level could see the stock pick up bullish momentum to test the $29 level, around the 38.2% Fibonacci retracement line.
Near-term Keys: A break above $26.50 could offer a useful signal to buy the stock or work with call options, with an eye on $29. A drop below $25.50, on the other hand could act as a strong signal to consider shorting the stock or working with put options, with an eye on a bearish trade target at around $53.50, or $52. The value proposition for BEN is very interesting, and so if you don’t mind taking a very long-term view, and are willing to accept the idea the stock could drop even further if the market turns bearish, the stock’s strong dividend provides a useful source of passive income, with an interesting value-based opportunity to be had in the long term.