Over the last couple of months, one of the big headwinds in the Transportation industry has been the impact of Boeing-related concerns tied to the extended grounding of the popular 737 Max jet. Two fatal crashes led carriers all over the world to ground the jet, with federal regulators scrutinizing the company’s production and engineering records in detail. Concern has mounted about the reinstatement of the jet to flight status to such an extent that it finally forced the ouster of Boeing’s CEO in December.
As one of just two airline manufacturers in the entire world, Boeing occupies one of the rarest spaces in the industrial world; that generally also means that continued delays in the 737 Max have forced airline carriers to cancel flights on a widespread basis and to start looking for other options to fill in the massive gaps the grounding has caused. That means that the few carriers who hadn’t previously added the Max to their fleets, or that don’t have pending orders waiting for delivery of a jet that many wonder whether it may not ever be allowed back into service, are at an advantage in the industry.
Delta Air Lines, Inc. (DAL) is a good example of the rare company that isn’t exposed to extended grounding risk related to the Max. That is probably one of the big reasons that the company’s fundamental profile has remained very solid throughout 2019. The stock’s performance over the last year has also been strong, having increased more than 20% since the beginning of 2019 to the current date. Over the last couple of weeks, however, the stock has dipped a bit, by about -5% to what looks like it could be a good technical set up for a rebound and rally higher. As a value-oriented investor, another question I like to consider is whether the stock also offers a useful value proposition. Let’s dive in and take a look.
Fundamental and Value Profile
Delta Air Lines, Inc. provides scheduled air transportation for passengers and cargo throughout the United States and across the world. The Company’s segments include Airline and Refinery. The Company’s route network is centered around a system of hub, international gateway and airports that the Company operates in Amsterdam, Atlanta, Boston, Detroit, London-Heathrow, Los Angeles, Minneapolis-St. Paul, New York-LaGuardia, New York- John F Kennedy International Airport, Paris-Charles de Gaulle, Salt Lake City, Seattle and Tokyo-Narita. Each of these operations includes flights that gather and distribute traffic from markets in the geographic region surrounding the hub or gateway to domestic and international cities and to other hubs or gateways. The Company’s route network includes its international joint ventures, its alliances with other foreign airlines, its membership in SkyTeam and agreements with multiple domestic regional carriers that operate as Delta Connection. DAL’s current market cap is $37.3 billion.
Earnings and Sales Growth: Over the last twelve months, earnings grew by almost 29%, while revenues increased by about 5%. In the last quarter, earnings dipped about -1.25%, while sales were flat, but slightly positive at 0.19%. The company operates with a healthy margin profile, with Net Income running at 10.12% of Revenues for the last twelve months, and increased to 11.9% in the last quarter.
Free Cash Flow: DAL’s free cash flow is healthy, at more than $3.6 billion – an increase from the middle of 2019 of $2.8 billion. That also translates to a Free Cash Flow Yield of 9.62%.
Debt to Equity: DAL has a debt/equity ratio of .89. The company’s balance sheet shows that operating profits are adequate to service their debt. The company has $1.9 billion in cash and liquid assets as of the most recent quarter against $13.3 billion in debt, which does verify that like most airline stocks, DAL is highly leveraged.
Dividend: DAL pays an annual dividend of $1.61 per share, which translates to a dividend yield of about 2.77% at the stock’s current price.
Price/Book Ratio: there are a lot of ways to measure how much a stock should be worth; but one of the simplest methods that I like uses the stock’s Book Value, which for DAL is $23.30 per share. That number also translates to a Price/Book ratio of 2.47 at the stock’s current price. Their historical average Price/Book ratio is 2.9. That suggests the stock is trading right now at a discount of about 17%, which is not quite as high as I usually prefer to see, but still pretty attractive.
Technical Profile
Here’s a look at the stock’s latest technical chart.
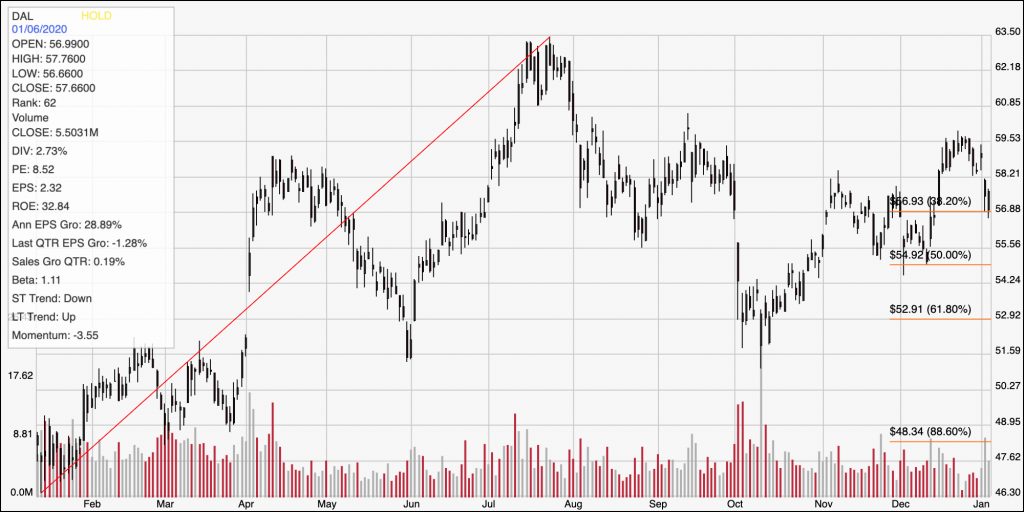
Current Price Action/Trends and Pivots: The chart above traces DAL’s price action over the last year. The red diagonal line traces its upward from from January of 2019 to its peak in late July at about $63.50. That line also informs the Fibonacci retracement lines shown on the right side of the chart. The stock dropped from that high to a low in October at around $53 per share, but has staged a new upward trend from that point to a recent peak at around $59.50 just about a week ago. The stock is a bit below that point now, and appears set to test support at the 38.2% retracement line. A pivot low and move back to the upside could set up a rally back to the $59.50 range, or possibly to test the 52-week high in the $63.50 area if bullish momentum continues. A break below support a bit below $57, however could see the stock test next support around $55, or $53 where the 61.8% retracement line rests.
Near-term Keys: The fundamentals for DAL are solid, and the value proposition is much better than it was just a few months ago. The stock’s bullish trend since October is a good reason to look for short-term bullish trade; you could use a pivot low around $57 as a good signal to think about buying the stock or working with call options with an eye on $59 as a very short-term target, or $63.50 in the event bullish momentum strengthens. A drop below $57 might be a useful signal to think about shorting the stock or working with put options, with an eye on a range between $53 and $55 as exit point for a bearish trade.