One of the things that I find fascinating about the stock market is the way that economic and industry dynamics impact stock prices. Part of the challenge – and therefore, the intrigue – comes from the fact that stocks don’t always react the way you would expect. What you may perceive as good news or positive indicators can often be interpreted in an entirely opposite fashion; in the same way, it isn’t a given that what is generally considered as negative information will have a commensurate, negative reaction.
In the airlines industry, one of the biggest news items of the past year has been the long-term grounding of the popular Boeing 737 MAX jet. Most industry experts, including executives of the airline companies that make up Boeing’s (BA) 737 MAX client base, had expected the jet to clear regulatory review of improvements to the system issue that have been blamed for two 2018 fatal crashes by the beginning of the fourth quarter. Late in 2019, however came news that regulators had flagged new concerns about the jet, which prompted American Airlines (AAL) and Southwest Airlines (LUV) to extend long-term groundings of the jets that make up significant parts of their fleets into March of this year.
The impact of the 737 MAX groundings, which have impacted LUV’s balance sheet – by some estimates, it’s caused a drawdown of more than $350 million in Net Income in the last two quarters – since the first quarter of the 2019 financial year, is negative news that you would naturally expect to act as a bearish dynamic for the stock. The irony is that while it certainly has impacted the stock’s volatility, the stock has still managed to increase in price by almost 13.5% since the beginning of 2019. LUV’s fundamental strengths include one of the strongest balance sheet in the entire industry, marked especially by healthy Free Cash Flow, and manageable debt levels have helped the company navigate the challenges and costs associated with grounding 34 of the jets that make up its fleet and forced the cancellation of more than 30,000 flights since the beginning of 2019.
The real question – and frankly, in LUV’s case, the very real risk – is whether the company’s prospects in 2020 remain bullish, or if the loss of Net Income caused by the grounding and subsequent cancellations is going to hinder their profitability even more than it already has. I think there is a very real possibility that fundamental risk could extend to and be reflected by the stock’s price performance. Let’s run through the numbers so you can decide for yourself.
Fundamental and Value Profile
Southwest Airlines Co. (Southwest) operates Southwest Airlines, a passenger airline that provides scheduled air transportation in the United States and near-international markets. The Company provides point-to-point service. The Company offers ancillary service offerings, such as Southwest’s EarlyBird Check-In and transportation of pets and unaccompanied minors, in accordance with Southwest’s respective policies. Southwest’s Rapid Rewards frequent flyer program enables program members (Members) to earn points for every dollar spent on Southwest fares. Its Internet Website, Southwest.com, is an avenue for Southwest customers to purchase and manage travel online. As of December 31, 2016, Southwest operated a total of 723 Boeing 737 aircraft and served 101 destinations in 40 states, the District of Columbia, the Commonwealth of Puerto Rico, and eight near-international countries: Mexico, Jamaica, The Bahamas, Aruba, Dominican Republic, Costa Rica, Belize, and Cuba. LUV’s current market cap is $28.2 billion.
Earnings and Sales Growth: Over the last twelve months, earnings increased by almost 14%, while revenues were mostly flat, but increased by 1.15%. In the last quarter, earnings declined -10%, while sales were also negative by -4.57%. The company operates with a healthy margin profile, with Net Income running at 10.89% of Revenues for the last twelve months, and improved in the last quarter to about 11.6%.
Free Cash Flow: LUV’s free cash flow is healthy, at $2.85 billion. That translates to a Free Cash Flow Yield of 10%, but has also declined since March of 2019, when it was about $3.3 billion.
Debt to Equity: LUV’s debt/equity ratio is .36, implying management has been very effective at managing their debt levels. More to the point, in the last quarter cash and liquid assets were a little over $4 billion, while long-term debt was around $3.58 billion. When you combine these numbers with the company’s healthy operating profits, you have a company that can service its debt very comfortably.
Dividend: LUV pays an annual dividend of $.72 per share, which translates to a dividend yield of about 1.33% at the stock’s current price.
Price/Book Ratio: there are a lot of ways to measure how much a stock should be worth; but one of the simplest methods that I like uses the stock’s Book Value. LUV’s Book Value is $18.48, which means that the stock’s Price/Book ratio right now is 2.93. Their historical average Price/Book ratio is 3.51, which offers a long-term target price just a little below $65 per share, which is about 19.5% higher than its current price, and a little above the stock’s all-time high in late 2017.
Technical Profile
Here’s a look at the stock’s latest technical chart.
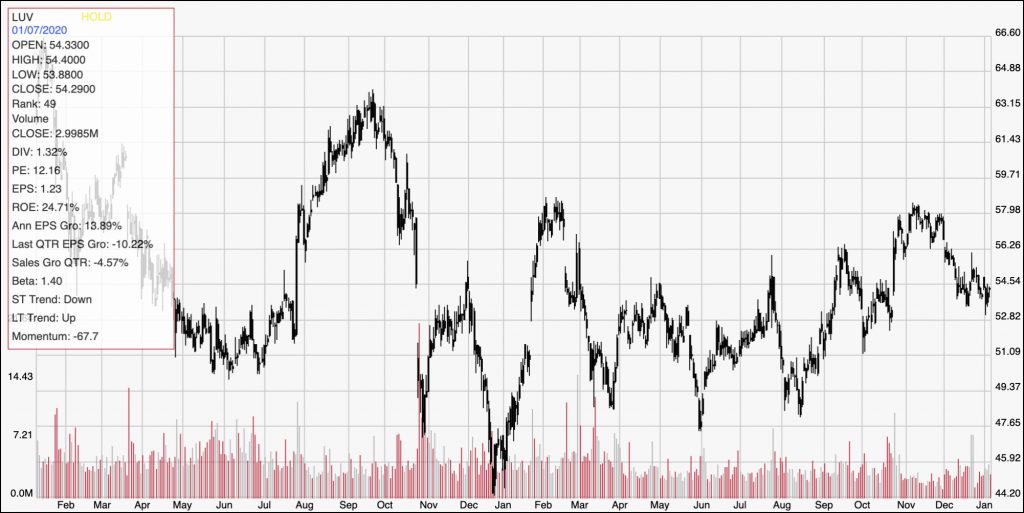
Current Price Action/Trends and Pivots: The chart above displays LUV’s price action over the last two years. While the stock has been in an upward trend since the beginning of 2019, the past two months has seen the stock pull back from a trend high point at around $58 per share to its current level. It appears to be finding support around the $53 level, and a pivot low in that area, with a solid bounce above immediate resistance at $55 from its last pivot high should give the stock momentum to rise to $58 per share. A break below $53 could see the stock drop to about $49 per share.
Near-term Keys: At its current price, LUV offers an interesting mix of fundamental strength and value; however the stock’s bullish momentum for the past year has moved the price past the level that I would consider a compelling value. Consider also that industry pressures – the 737 MAX, along with some forecasts that predict decreased consumer travel through 2020 – could limit how much upside the stock could see. If you prefer to work with short-term trading strategies, a break above resistance at $55 could act as a useful signal for a bullish momentum trade with call options or by buying the stock outright with a bullish target at around $58. A drop below support at around $53 could offer an interesting bearish trade by shorting the stock or working with put options, with an eye on $49 as a target price in that case.