Moving into 2020, with trade tensions between the U.S. and its biggest trading partners fading, many analysts are calling for the broad market to continue following its long-term trend that saw an impressive acceleration in pace and strength in 2019. One of the sectors that appeared set to suffer from tariffs on steel and aluminum was Basic Materials; but compromise as demonstrated by the U.S.-Mexico-Canada Agreement (USMCA) that replaced NAFTA, agreement with the European Union and a “Phase One” agreement with China seems to offer good potential for the sector in the year ahead. That is something that could also extend to companies in the Steel Producers industry.
Despite its status as one of the biggest steel producers in the country, United States Steel Corp (X) remains listed as a “small-cap” stock, at least in part because of the fact that the stock is down a little over -77% since March of 2018, when it peaked a little below $48 per share. Declines such as these can often be indicative of broad industry pressures, and that is generally true for many of the companies in this industry. However, the longer it lasts, the longer the risk becomes that the market is correctly pricing other fundamental problems about the company into its stock. Does that mean that X is just an extremely cheap stock to be avoided, or could it possibly be a diamond in the rough, a stock that the market has ignored for all the wrong reasons? Let’s dive in and try to find out.
Fundamental and Value Profile
United States Steel Corporation is an integrated steel producer. The Company is engaged in producing flat-rolled and tubular products with production operations in North America and Europe. The Company operates through three segments: Flat-Rolled Products (Flat-Rolled), U. S. Steel Europe (USSE) and Tubular Products (Tubular). The Flat-Rolled segment includes the operating results of its integrated steel plants and equity investees in the United States involved in the production of slabs, rounds, strip mill plates, sheets and tin mill products, as well as all iron ore and coke production facilities in the United States. The USSE segment includes the operating results of U. S. Steel Kosice (USSK) and its integrated steel plant and coke production facilities in Slovakia. The Tubular segment includes the operating results of its tubular production facilities, primarily in the United States and equity investees in the United States and Brazil. X’s current market cap is $1.8 billion.
Earnings and Sales Growth: Over the last twelve months, earnings declined more than -111% (not a typo) while revenues dropped almost -18%. In the last quarter, earnings declined -146% while revenues declined nearly -13.5%. X’s margin profile is a particular sign of weakness; as a percentage of Revenues it declined from 4.56% over the last twelve months to -2.73% in the last quarter.
Free Cash Flow: X’s free cash flow measurement is also a big red flag, at -$717 million. It has also declined from about $450 million in mid-2017. I believe this is one of the biggest drivers of the stock’s decline since early 2018, which suggests that the market is taking this measurement at face value. Digging deeper, however shows that Free Cash Flow has declined because the company has been actively investing in operational improvements designed to refocus their business from their traditional steel products to “value-added” products that now represent about 70% of their business. Those initiatives are budgeted to continue into 2020, after which management expects them be accretive to their bottom line.
Debt to Equity: X has a debt/equity ratio of .64, which by itself is healthy. Their balance sheet shows $486 million in cash and liquid assets (but down by $1.3 billion since September 2018) against about $2.7 billion in long-term debt.
Dividend: X pays an annual dividend of $.20 per share, which translates to a yield of about 1.8% at the stock’s current price. That isn’t very impressive by itself; but the fact the company has maintained their dividend even as they have put increasing emphasis on transformation of their business can be considered a signal of strength.
Price/Book Ratio: there are a lot of ways to measure how much a stock should be worth; but one of the simplest methods that I like uses the stock’s Book Value, which for X is $24.70 and translates to a Price/Book ratio of .44 at the stock’s current price. Their historical average Price/Book ratio is 1.21; that puts a target price at nearly $30, which is 275% above the stock’s current price.
Technical Profile
Here’s a look at the stock’s latest technical chart.
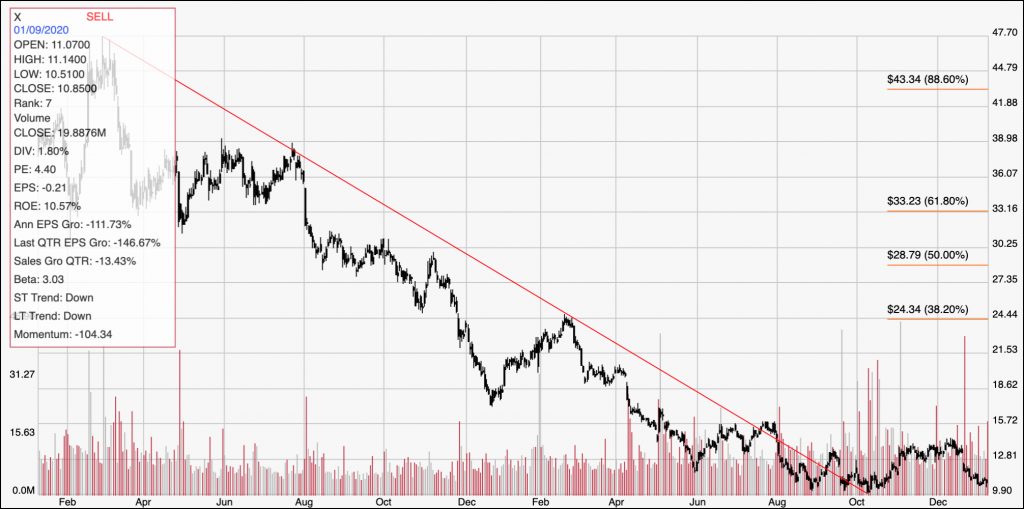
Current Price Action/Trends and Pivots: The diagonal red line traces the stock’s downward trend from March 2018 to October of last year, and provides the reference for calculating the Fibonacci retracement levels indicated by the horizontal red lines on the right side of the chart. The stock bottomed a little below $10 at that time, then rebounded to about $14 in late December before dropping back to its current level a little below $11 per share. The stock’s closest resistance is likely to be around $12 based on a pivot high from September, with room to about $14.50 if it can break above $12. Support is at $10, and a drop below $10 could see the stock drop to a low between $6 and $7 per share at the beginning of 2016.
Near-term Keys: Unfortunately, I don’t think the fundamentals for X justify any kind of a useful, long-term, value-based opportunity. If the company’s transformation strategy begins to gain traction, it should be seen first by improvements in Net Income, Free Cash Flow, and cash and liquid assets. Those would mark a good time to take the stock seriously as a long-term investment. Short-term trading strategies are therefore the most suitable for this stock. A break above $12 could offer an interesting buying opportunity, either with the stock or with call options, with an eye on $14.50 as a target price, while a drop below $10 should offer an opportunity to short the stock or buy put options with an eye on $6 to $7 per share as a profit target.